Dashboard
The Wealth Dashboard offers a 360-degree view of your investment details. The Wealth Dashboard provides the My Assets view, where the investments across the asset classes are displayed in the form of a pie chart. The account details that include individual and consolidated investment accounts are available along with a separate option to view the Savings and Checking account details. The Wealth Dashboard also contains a Today’s Market news section, where the different global indices can be configured.
UX Overview
The UX Overview section provides information about the user interface of the Dashboard module.

Dashboard Overview
| Section | Component | Configurable Elements |
|---|---|---|
|
Total Assets: This section displays the total value of the assets along with a graphical representation of the asset categorization. This section is not available as part of the Transact Integration. |
NA | |
|
My Investment Summary: This section displays a graphical representation of your investments along with a list of your investment accounts. |
com.wealth.common.investmentLineChart | NA |
| Personal Accounts: This section displays a list of all your accounts. | NA | NA |
|
Today's Markets: This section displays details about the current market. The data for the Today's Markets section is retrieved from the Market Data Provider. |
com.konyolb.wealth.marketIndexDashComp | NA |
|
Top News: This section displays the latest stock news. The data for the Top News section is retrieved from the Market Data Provider. |
com.konyolb.wealth.marketNewsCardComp | NA |
|
Watchlist: This section displays the instrument details or the asset added to your watchlist. You can also set an alert price to the instrument in the watchlist.
|
com.olb.wealth.WatchlistDashCard | NA |
| Recent Activity: This section displays the recent activities of your portfolios. | com.olb.wealth.recentActivityComp | NA |
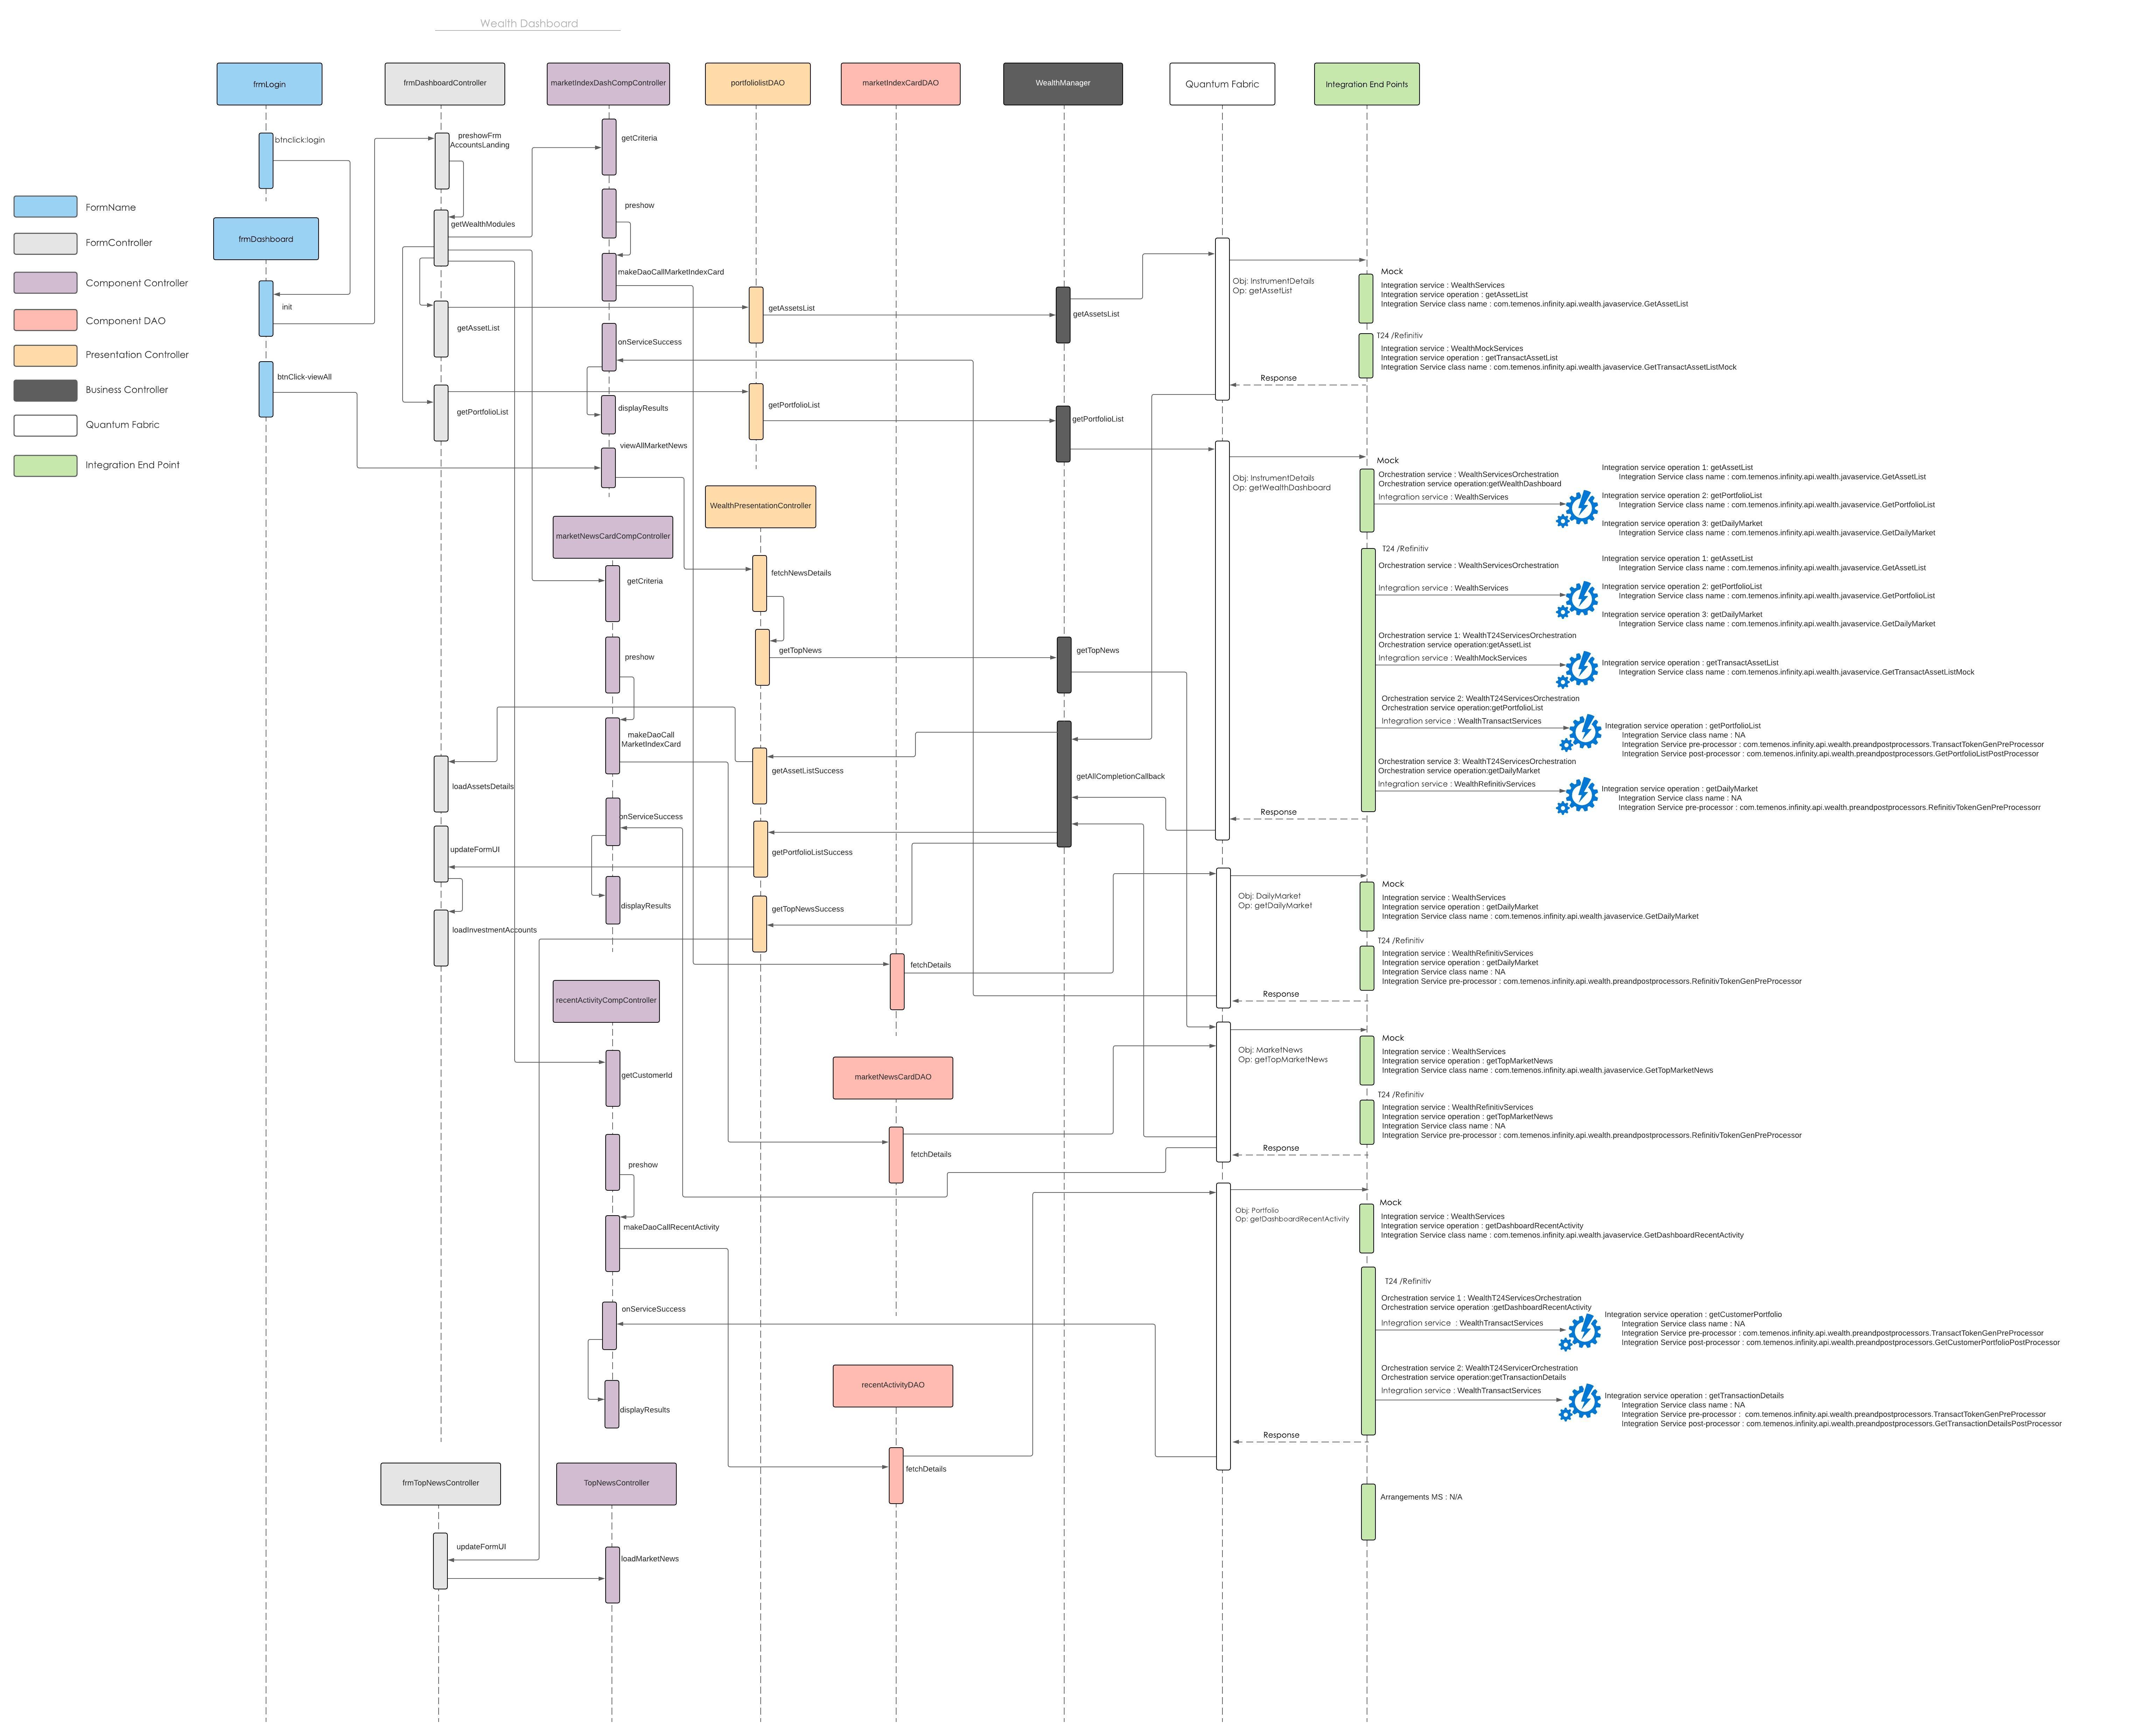
Sequence Diagram -Dashboard
Feature Description
The Wealth Dashboard also displays your investment summary and details of the other bank accounts. From the landing page, you can navigate to the subsequent sections of the wealth functions.
Mobile Native Screens


Total Assets

Total Assets
The Total Assets feature displays your assets, which are categorized into different asset classes, which includes Investment Cash Accounts, Savings Accounts, and Checking Accounts. It displays the accounts of which you are the primary account holder.
The allocation is displayed in the form of a pie chart. It also displays the total value of the assets, the list of assets, and the respective values and proportion percentages.
On hovering over the graph, the corresponding asset class is highlighted in the list and magnified in the graph.

Total Assets Pie Chart
Mobile Native Screens


My Investment Summary

My Investment Summary
Investment Summary displays a consolidated overview of your investments and portfolios. It displays the evolution of your accounts over the past months along with the following details:
- The total value of your investments
- Unrealized P&L: Specifies the difference between the current market value and the weighted average cost of the buy. Profit is displayed in Green and the loss is displayed in Red.
- Performance: Specifies the consolidated performance percentage value of your investments and portfolios. Profit is displayed in Green and the loss is displayed in Red.
You can select the time period for which you can view your investments. The predefined time periods are as follows:
- 1M: The graph displays the details for the last month from the current day.
- 1Y: The graph displays the details for the last year from the current day.
- 5Y: The graph displays the details for the last five years from the current day.
- YTD: The graph displays the details from the beginning of the year to the current day.
On hovering over the graph, the corresponding investment details at a particular time are displayed.
Investment Summary also displays the list of investment accounts with their respective value and gain or loss. You can also place a trade and view the details of your investments. When you click an investment account, the Investment Account page appears, which contains details about the account. For more information about an instrument, click here.
Mobile Native Screen

Today's Market

Today's Market
The Today's Market module provides information about the market movements. It displays the global indices along with the index value, the gain or loss for the day, and the percentage of gain or loss.
Mobile Native Screen

Today's Market
When you click View All, the Top News section appears.
Top News

Top News
The Top News feature displays a list of current news. You can view the details of every news item by clicking the Show More option. The news feed is fetched from the Market Data Provider.

Top News Detailed Screen
Mobile Native Screens


Watchlist

Watchlist
The Watchlist feature displays a list of instruments that you marked as favorite. With the Watchlist, you can quickly view the details of your favorite instruments from the Dashboard.
When you click View All, the Watchlist Instrument section appears.

Watchlist Detailed Screen
It displays the list of instruments that are added to the watchlist along with the following details:
- Instrument: Specifies the name of the instrument.
- Currency: Specifies the reference currency of the instrument.
- Latest: Specifies the latest price of the instrument.
- Change: Specifies the date and time at which the instrument price changed. The price change can be either positive or negative. The price change is also displayed in terms of percentage.
- Date/Time: Specifies the date and time at which the instrument price changed.
- Bid: Specifies the best available price to buy the instrument.
- Ask: Specifies the best available price to sell the instrument.
- Volume: Specifies the total volume of both buy and sell.
- Unrealized P&L: Specifies the difference between the current market value and the weighted average cost of the buy. Profit is displayed in Green and the loss is displayed in Red.
- Add New Instrument : This option lets you to add a new instrument to the watchlist. To do so, click on Add New Instrument. Add/Remove Instruments pop-up window appears. Enter the instrument name in the Search field and press Enter. The instrument list matching the entered criteria appears. Select the instrument and click Add. The selected instrument appears in the watchlist list.
- Search :You can search for a specific instrument using the Search field.
- Download :This option lets you download the instrument list using the download icon. Click the download icon, and a PDF file with all the details is downloaded to your local system.
- Print : This option lets you print the watchlist instruments using the Print icon. Click the Print icon, and the Print window appears.
You can also delete the instrument from the watchlist by clicking on the Remove option. This option is displayed in the search field if the instrument is already added to the watchlist.


Mobile Native Screens


The data for Latest, Change, Bid, Ask, Volume, and Date/Time is updated by the Market Data Provider:
You can perform the following actions on the Watchlist page:
- View: From the Contextual Menu of the desired instrument and select View. The respective instrument page opens.
- Buy: From the Contextual Menu of the desired instrument and select Buy. The Place a New Order screen appears. For more information about how to place an order, click here.
- Sell: From the Contextual Menu of the desired instrument and select Sell. The Place a New Order screen appears. For more information about how to place an order, click here.
- Delete: From the Contextual Menu of the desired instrument and select Delete. The instrument is deleted from the Watchlist list.
- Set Price Alerts: The instruments in the watchlist can be set with price alerts. This functionality only allows capturing the price alert data. Click on the drop-down arrow to expand. Choose the Alert Price Condition option either as "Less Than" or "Greater Than" from the drop-down list. Enter the Alert Price and click Set Alert.

Set Alert Price Condition

Set Alert Price

Alert Price Confirmation

Remove Alert Price
A confirmation message as "Alert successfully set" appears.
You can either remove the alert price value by clicking on the Remove option or modify the alert price by changing the alert price condition /alert price value. On successful modification, a confirmation screen indicating the alert is modified successfully appears.
Mobile Native Screens


Business Process Diagram - Watchlist
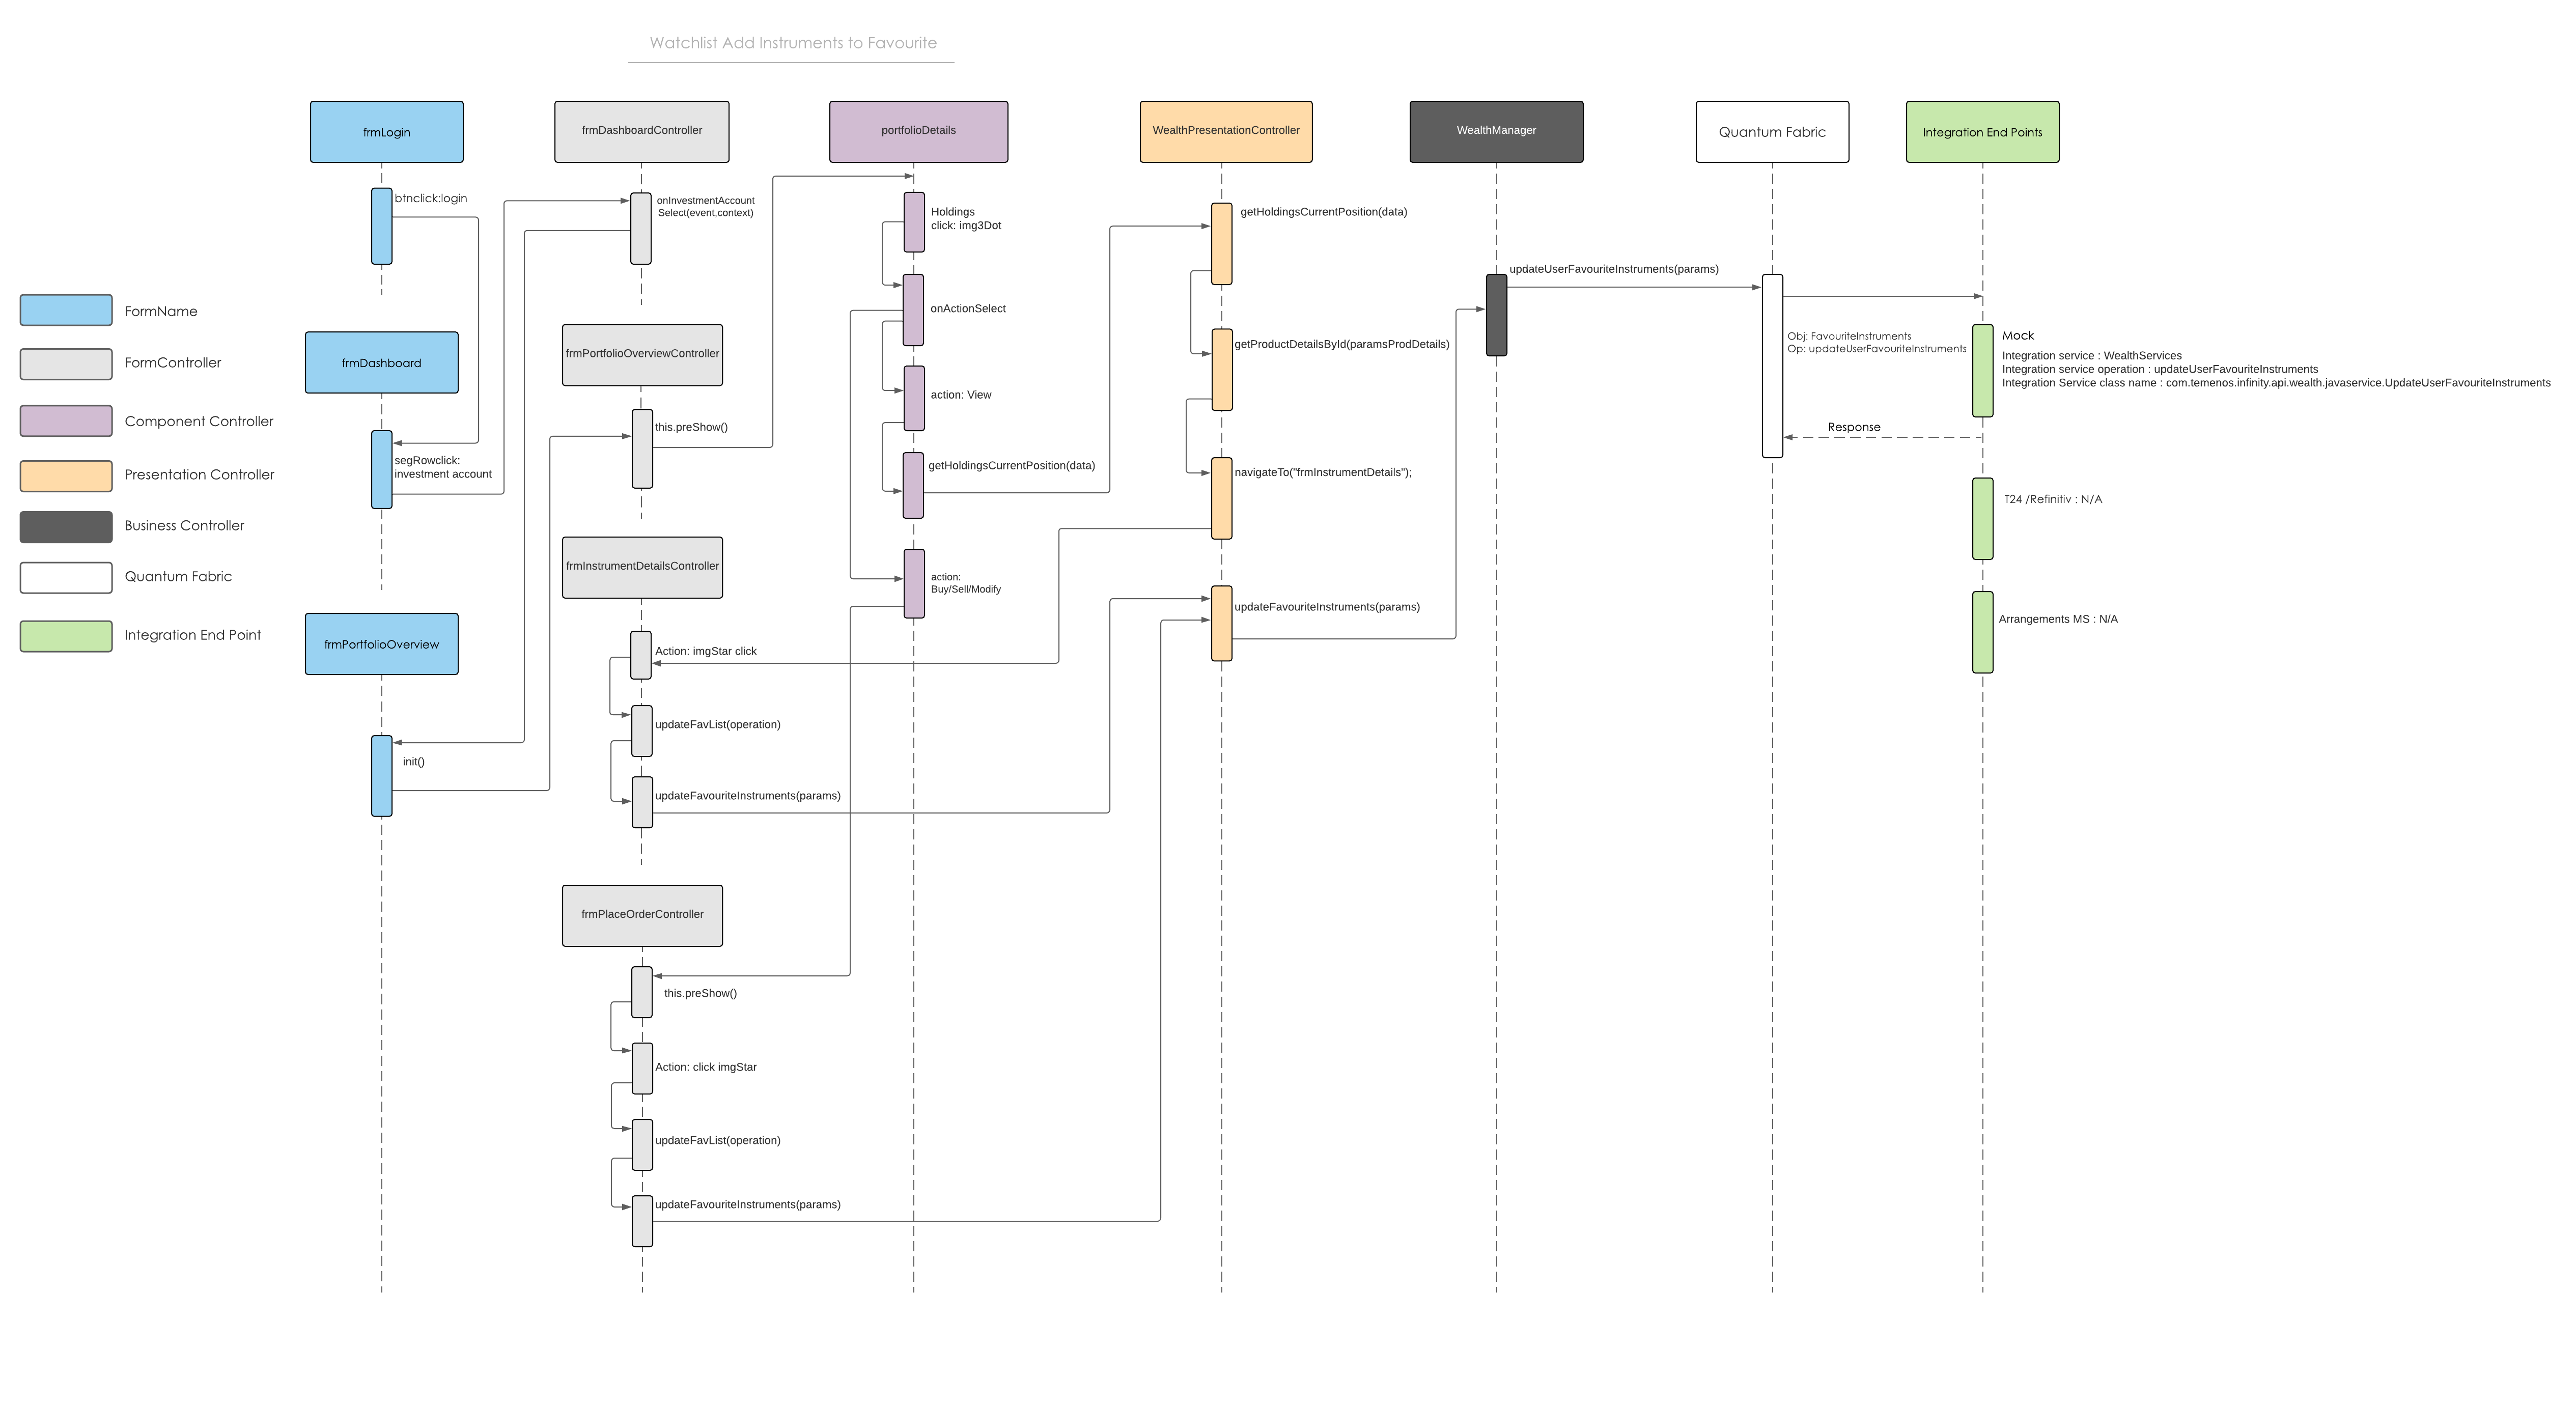
Sequence Diagram - Watchlist
Recent Activity

Recent Activity
The Recent Activity section displays the recent history of your investment accounts. It only displays the completed transactions that occurred in the past week.
Mobile Native Screens


Personal Accounts

Accounts
The Personal Accounts section displays your accounts, which are categorized into different types such as Savings Accounts, Checking Accounts, Credit Cards, and Loan Accounts. It lists down the account names along with the available balance.
It also displays the number of accounts in each category and the Total Available Balance of all the accounts as the. The Total Available Balance is displayed only if all the accounts are of the same currency.
You can select the type of accounts that must be displayed by selecting the desired option from the Showing drop-down list. To filter the type of accounts that are being displayed, click the Filter icon, select the desired options, and then click Apply.
When you click a specific account, the account details screen appears that provides information about your account. For more information, refer to Account Details and Transactions.
In this topic