Platform Framework
R24 AMR | Min(s) read
Debugging JBC Code using JAVA
This section shows how to debug JBC code, which is not deployed in the application server, using JAVA.
For API, the JBC code is not deployed in an application server and the start point in not JBC. In this case, you must launch a JAVA POJO, which invokes JBC code. If the invocation is local, you must follow the below steps.
- Follow the steps 1 to 4 given in the Debugging Sessions in Application Server section.
- Enable the Put Eclipse in “Listen” mode (eg for API debug) if launched from JAVA checkbox in the New Launch Configuration dialog box, for the JBC to connect to Eclipse as soon as it is invoked. The Host field becomes invalid.
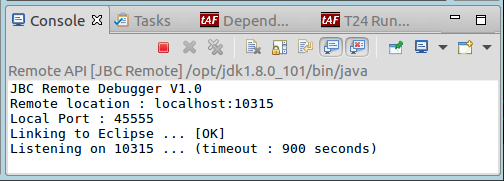
- Click Apply and launch your target. The below screen capture display the Console view. The Debug view looks the same as the Console view.
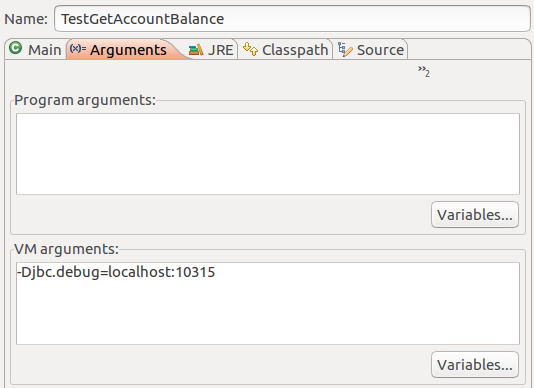
- Launch your JAVA program, by specifying -Djbc.debug=<host_of_eclipse>:<port> (java launch configuration) in the VM Arguments section.
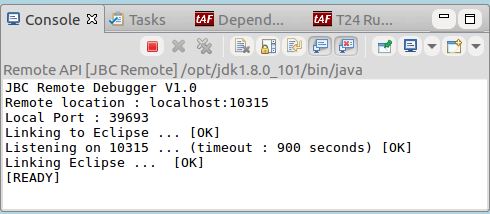
TestGetAccountBalance.java calls a JBC routine, once entered. The below screen capture displays the Console view.
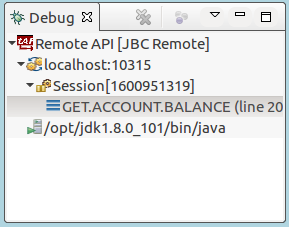
The Debug view displays the break point in the JBC, if any
JBC code can now be debugged using JAVA.
If the invocation is remote, the JBC code is deployed in an app server and you must use the procedure explained in Debugging Sessions in Application Server to debug your target.
In this topic