TAFJ Sessions and Technical Monitoring
You can monitor the TAFJEE application by browsing http://<host>:<port>/TAFJEEMonitoring/monitoring. This section deals with the TAFJ sessions monitor, technical monitor and JavaMelody.
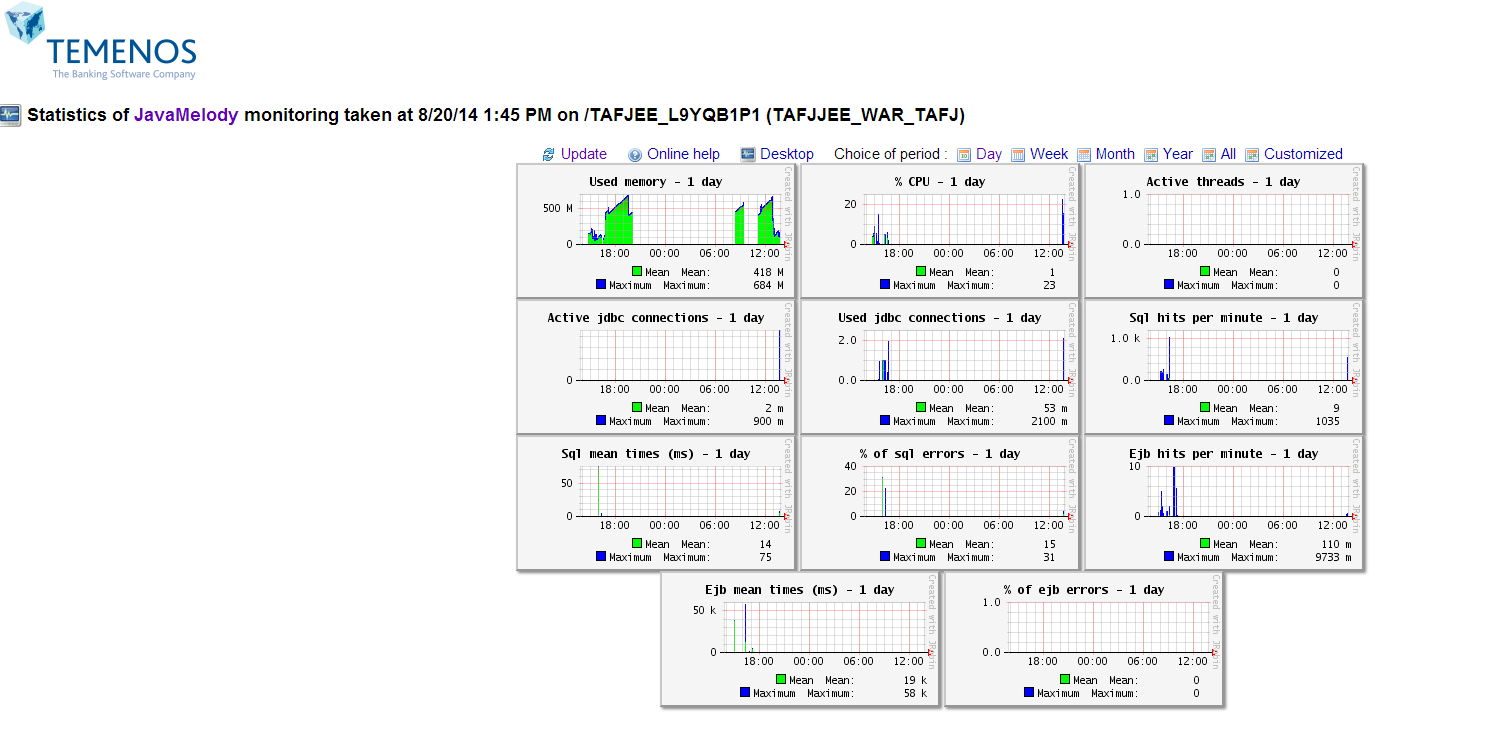
JavaMelody is an open source application to monitor Java or Java EE applications in QA and production environments. This tool is for reporting—measures application usage and provides statistical details.
With very low overhead it gives some statistics and charts about:
- Memory threads, CPU
- SQL statements
- Numbers of EJBs call and response time
- Error logs
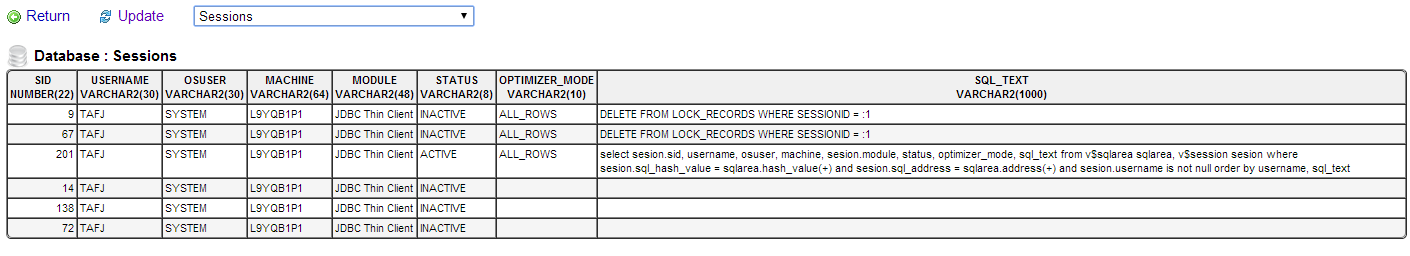
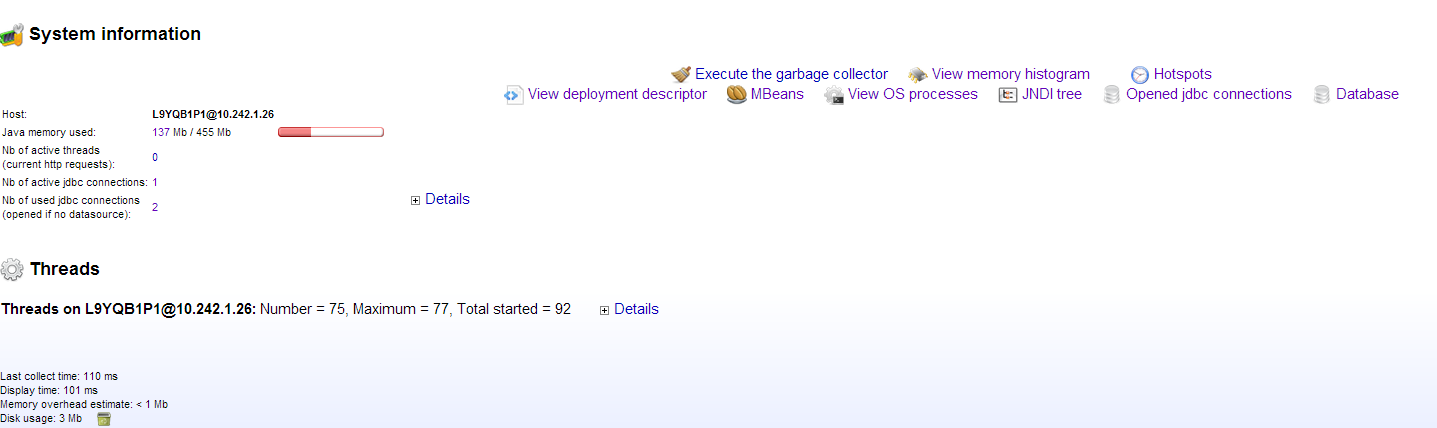
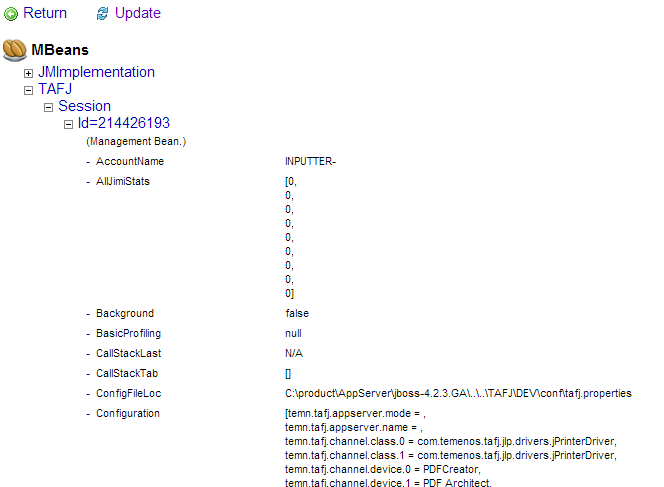
- MBeans and active sessions
- Database information


JavaMelody does not require a database to store events or code instrumentation.Therefore it could be enabled in production because of its low overhead (from null to 5%).
The JavaMelody libraries found under TAFJJEE_EAR/APP_INF/lib are:
| File | Description |
|---|---|
|
javamelody.jar |
Core library, which is a patched version of official JavaMelody to cover additional need. |
|
jrobin.jar |
RRD tool java implementation to log data and do graph rendering. |
The various functions offered by JavaMelody for TAFJ are as follows:
The monitoring functionalities are enabled through the MonitoringFilter servlet, declared in TAFJJEE_EAR/ TAFJEEMonitoring /WEB-INF/web.xml.
<filter>
		<filter-name>monitoring</filter-name>
		<filter-class>net.bull.javamelody.MonitoringFilter</filter-class>
	</filter>
	<filter-mapping>
		<filter-name>monitoring</filter-name>
		<url-pattern>/*</url-pattern>
	</filter-mapping>
JavaMelody also defines a SessionListener to monitor http sessions, which is not used for TAFJJEE.
There are several parameters configured to refine JavaMelody setup. These parameters can be defined in various ways—as filter parameter, context parameter or system properties at application server level.
The parameters’ order of precedence is as follows:
- System property
- Context parameter
- Filter parameter
The parameters are defined in TAFJJEE_EAR/TAFJEE/WEB-INF/web.xml as Context parameters to have a unified way to do it and to avoid application server restart to apply a value change.
This parameters used to monitor TAFJJEE are as follows:
To disable monitoring, you need to set javamelody.disabled=true.
<!-- turn off javamelody -->
<context-param>
<param-name>javamelody.disabled</param-name>
<param-value>false</param-value>
</context-param>
You can use the javamelody.displayed-counters parameter to override the counters displayed by default. As TAFJJEE does not make use of http session, we remove some of them.
<!-- counters - we don't want to display the default one "http,sql,error,log"
as we don't need http monitoring -->
<context-param>
<param-name>javamelody.displayed-counters</param-name>
<param-value>sql,log,ejb</param-value>
</context-param>
By default, a jndi lookup is issued to retrieve all data sources declared at application level. The optional parameter javamelody.datasources allows declaring the data sources to monitor if there is a need to exclude the locking data source or websphere internal EJB timer derby data source.
<!-- datasources to be monitored -->
	<!-- they could be retrieved dynamically through jndi lookup but we might want to exclude some -->
	<!-- i.e. WAS internal derby DS for EJBTimer or locking DS -->
	<context-param>
		<param-name>javamelody.datasources</param-name>
		<param-value>java:comp/env/jdbc/t24DataSource,java </param-value>
	</context-param>
The multiple data sources (if any) need to be coma separated. The first data source is displayed in the Database Information screen. They also need to be defined at TAFJEE.war level to have the jndi lookup resolved (optional if the property is not used).
By default, JavaMelody stores graphs in .rrd files for and statistics in .gz files on disk in the temporary directory of the application server or in the temporary directory of the host, defined by the java.io.tmpdir system property. This is the directory to clear to clean up all statistics and graphs.
The javamelody.storage-directory property is used to override the default temporary directory.
<!-- statistic storage directory -->
<context-param>
<param-name>javamelody.storage-directory</param-name>
<param-value>C:\javamelody-storage-dir</param-value>
</context-param>
If the name of the directory starts with /, with drive specifier followed by \ or if its prefix is \\, it is considered as an absolute path. If not, it is considered as relative to the temporary directory. If this parameter is changed it is recommended to rename the physical directory as well.
The javamelody.no-database property disables all SQL and JDBC monitoring when set to true. In that case, SQL counters are not displayed.
<!-- turn off sql monitoring when set to true -->
<context-param>
<param-name>javamelody.no-database</param-name>
<param-value>false</param-value>
</context-param>
The log-threshold-level property is specific to the patched TAFJJEE JavaMelody version.
By default, JavaMelody reports warning and error messages from different application logging systems (java util logging, log4j, logback).
This parameter allows refining this setup. By default we want to report only ERROR messages. It could also be used to turn off this functionality.
It is not recommended to use the lowest logger level value because of its verbosity and the intended purpose of this functionality is to report only the last 100 log messages received.
The valid values of this parameter are:
- ERROR
- WARNING
- INFO
- DEBUG
- OFF
When set to OFF, the log counter is not displayed.
<context-param>
<param-name>javamelody.log-threshold-level</param-name>
<param-value>ERROR</param-value>
</context-param>
This parameter d should be used only during development phase and not production.
By adding javamelody.sampling-seconds property, the hotspot detection will be enabled and stack-trace sampling will be executed every x seconds according the property value. The recommended value for the lowest overhead is 10 seconds, but could be lower (1, 0.1) in case of expected faster test results.
<!-- hotspot detection -->
<context-param>
<param-name>javamelody.sampling-seconds</param-name>
<param-value>10</param-value>
</context-param>
The javamelody.sampling-excluded-packages property refines the default list of package excluded during hotspot detection.
<context-param>
<param-name>javamelody.sampling-excluded-packages</param-name>
<param-value>java,sun,com.sun,javax,org.apache,org.hibernate,oracle,org.postgresql,org.eclipse,org.jboss,com.arjuna,org.jnp</param-value>
</context-param>
To monitor EJBs requests, you need to declare an interceptor in the ejb-jar.xml of the EJB to be monitored. The default java melody interceptor is net.bull.javamelody.MonitoringInterceptor. It can be replaced with a specific TAFJ interceptor to classify request per OFS source.
<interceptors>
	<interceptor>
<interceptor-class> com.temenos.tafj.monitoring.interceptor.MonitoringClassifierInterceptor
</interceptor-class>
	</interceptor>
</interceptors>
This interceptor needs to be associated to the targeted EJB or MDB within the assembly descriptor section of the ejb-jar.xml to monitor all EJBs.
<assembly-descriptor>
…
<interceptor-binding>
    		<ejb-name>*</ejb-name>
    		<interceptor-class>com.temenos.tafj.monitoring.interceptor.MonitoringClassifierInterceptor
</interceptor-class>
</interceptor-binding>
By default, TAFJJEE is configured to monitor all EJBs activities. You can disable this completely by removing this interceptor declaration or restricting the ejb name to the EJB to be monitored instead of mapping them all.
<ejb-name>*</ejb-name>

Could be replaced with

<ejb-name>BROWSERProcessingBean</ejb-name>
To monitor multiple specific EJBs, the interceptor binding section should be replicated per EJB.
Limitations and Known Issues
This section provides details about the limitations and known issues for WebSphere and JBoss servers.
The limitations and known issues for WebSphere are as follows:
When deploying JavaMelody in websphere (till version 8.5), the monitoring filter is not automatically initialised at application startup as it is according to the servlet specification.
You need to add the com.ibm.ws.webcontainer.invokeFilterInitAtStartup = true custom property to the webcontainer of the server. Otherwise the monitoring filter will not start until the TAFJEE servlet gets invoked.
By default, JavaMelody core does not provide rewrapping to monitor websphere data source. It produces the following error.
FFDC Exception:javax.naming.NamingException SourceId:com.ibm.ws.naming.util.Helpers.processJavaObjectForBinding ProbeId:682 Reporter:java.lang.Class@a18ab83c

javax.naming.NamingException: com.sun.proxy.$Proxy43.getReference() returned null in violation of the JNDI API
at com.ibm.ws.naming.util.Helpers.processJavaObjectForBinding(Helpers.java:670)
at com.ibm.ws.naming.jndicos.CNContextImpl.doRebind(CNContextImpl.java:2076)
at com.ibm.ws.naming.jndicos.CNContextImpl.rebind(CNContextImpl.java:697)
at com.ibm.ws.naming.util.WsnInitCtx.rebind(WsnInitCtx.java:233)
at com.ibm.ws.naming.util.WsnInitCtx.rebind(WsnInitCtx.java:245)
at org.apache.aries.jndi.DelegateContext.rebind(DelegateContext.java:177)
at javax.naming.InitialContext.rebind(InitialContext.java:452)
at net.bull.javamelody.JdbcWrapperHelper.rebindDataSource(JdbcWrapperHelper.java:119)
at net.bull.javamelody.JdbcWrapper.rebindDataSources(JdbcWrapper.java:452)
Mbeans are not displayed in JBoss 6.1 EAP because of following JBoss redhat issue.
“error JMX JBAS019905 should not get called”
You can stop the server and clean up the directory defined in property javamelody.storage-directory to clear all statistics and graphs. Deleting the .rrd files cleans up the graphs and deleting .gz files cleans up the statistics.
TAFJ Sessions Monitor
Procedure
- Untar the file TAFJSessionMonitor.tar.gz in $TAFJ_HOME from $TAFJ_HOME/TAFJSessionMonitor
- Check the $TAFJ_HOME/TAFJSessionMonitor/config/SessionMonitor.properties file for the following properties.
- tcp_port=8377 - Port used between TAFJ and TAFJSessionMonitor.
- http_port=8370 - Port used for the HTTP URL.
- Run start.sh or start.bat (depending on the operating system) in $TAFJ_HOME /TAFJSessionMonitor/bin
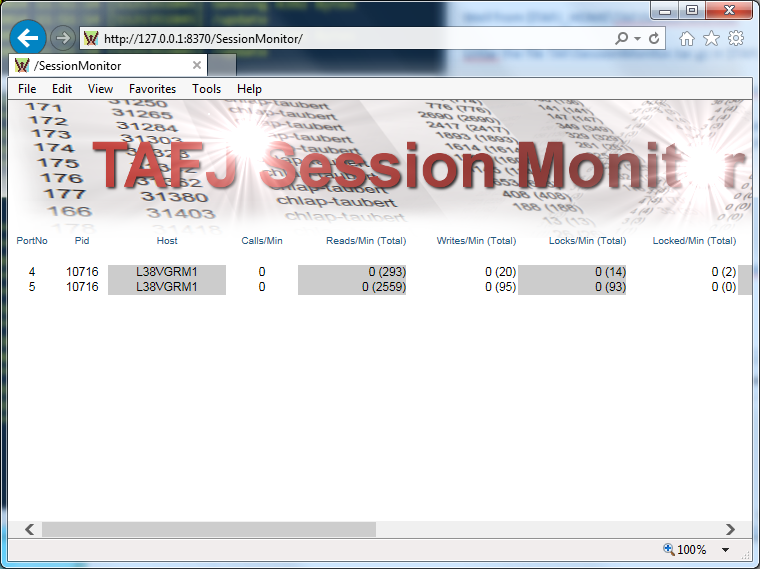
- Access the URL http://<IP>:<http_port>/SessionMonitor/. For example, http://127.0.0.1:8370/SessionMonitor/
- Configure the following properties in the tafj.properties file.
The following code shows the properties file setup with TAFJ.
#********************************************************************
#
#  TAFJ Monitor
#
#********************************************************************
# Enable the TAFJMonitorSession
#
temn.tafj.runtime.session.monitor.enable        = true  <= to enable the monitor

# Host name or IP of where is the TAFJMonitorSession
#
temn.tafj.runtime.session.monitor.host          = localhost <= where is your TAFJSessionMonitor

# TCP port of the TAFJMonitorSession
#
temn.tafj.runtime.session.monitor.port          = 8377<= the tcp_port of TAFJSessionMonitor
The following options are used to start the session monitor:
| Option | Description |
|---|---|
|
-f |
Indicates the file recording mode. |
|
-refresh <time in seconds> |
Indicates the time to refresh the contents. The default value is five seconds. |
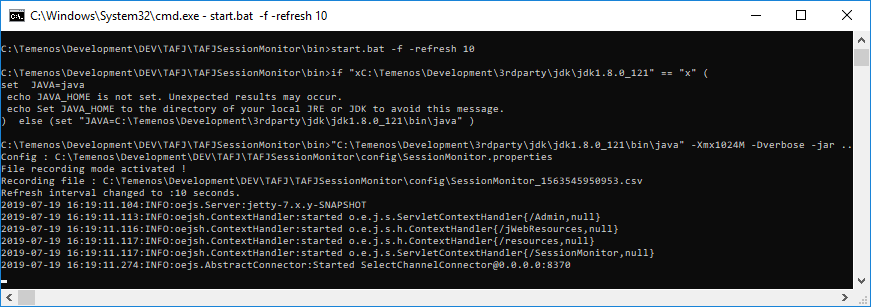
The following example shows the usage of -f and -refresh <time in seconds> options.
start.cmd/sh -f –refresh 10
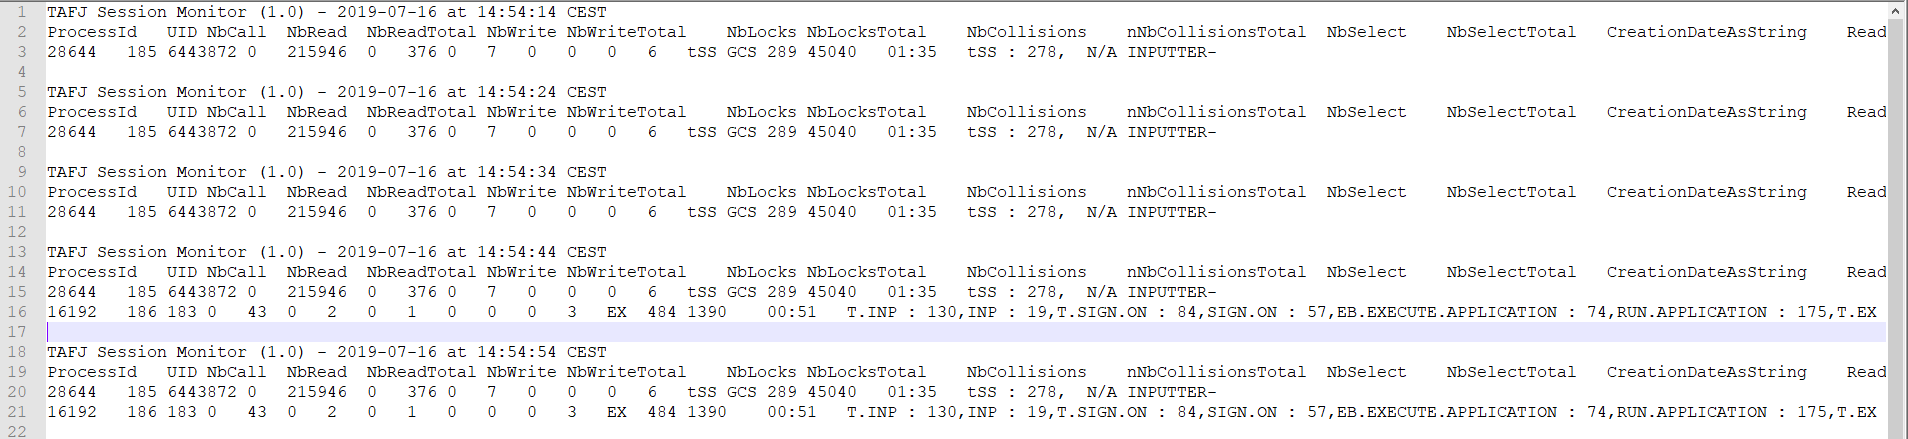
You can retrieve the recorded file from the $TAFJ_HOME /TAFJSessionMonitor/config folder.
Below is the sample content of the recorded file from the above example.
TAFJ Session Monitor Secure Access using HTTPS Port
You can access TAFJ Session Monitor securely using the following procedure.
- Check the file $TAFJ_HOME /TAFJSessionMonitor/config/SessionMonitor.properties for the following properties:
- tcp_port=8377 - Port used between TAFJ and TAFJ Session Monitor.
- https_port=8371 - Port used for the HTTPS URL.
- EnableSSL = false - By default, value is false. To access Session Monitor page via HTTPS, value should be set to true.
- path_jks = <Keystore_path> - Path reference to the generated keystore.
- store_password = <keystore_manager_password> - Keystore manager password of the generated keystore.
- key_password = <keystore_password> - Keystore password of the generated keystore.
For more information, see the https://www.eclipse.org/jetty/documentation/current/configuring-ssl.html URL.
Sample snippet:
EnableSSL=true
tcp_port=8377
http_port=8370
https_port=8371
path_jks=C:/javasoft/jdk-8u231-windows-x64/bin/keystore.jks
store_password=123456
key_password=123456
- In $TAFJ_HOME /TAFJSessionMonitor/bin, run start.sh or start.bat depending on your operating system.
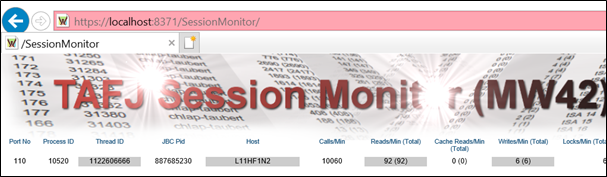
- Browse https://<IP>:<https_port>/SessionMonitor/.
For example, https://localhost:8371/SessionMonitor
In this topic