TAFJEE Servlet Components
This section provides the overview of all the available TAFJ servlets and their functionalities.
This is a web module which contains following servlets:
|
Component |
Functionality |
|---|---|
|
ExecuteServlet |
Sends message to the EXEC JMS Queue, for example start a COB with START.TSM. |
|
tDiagServlet |
Gets information about the installation. |
|
tShowServlet |
Gets information about a Temenos Transact routine if present in the classpath |
|
LoggerServlet |
Changes the log level dynamically and accesses log files. |
|
ComoServlet |
Accesses como content with some filtering capabilities. |
|
DBToolsServlet |
Executes DBTools command through the application server data sources. |
|
tRun |
Executes program in the background. |
|
Sessions management |
Manages logoff sessions. |
This component contains documentation about the interaction capabilities from external applications and standalone customer with TAFJEE, and a technical monitor.
TAFJEE is configured in WEB-INF\web.xml with the following properties under the xml path web-app.
|
Xml path |
Example value |
Comment |
|---|---|---|
|
servlet-mapping\url-pattern |
/Execute |
Indicates the mapping url for the ExecuteServlet |
|
servlet-mapping\url-pattern |
/tShow |
Indicates the mapping url for tShowServlet |
|
servlet-mapping\url-pattern |
/tDiag |
Indicates the mapping url for tDiagServlet |
|
servlet-mapping\url-pattern |
/logger |
Indicates the mapping url for LoggerServlet |
|
servlet-mapping\url-pattern |
/como |
Indicates the mapping url for ComoServlet |
|
servlet-mapping\url-pattern |
/DBTools |
Indicates the mapping url for DBToolsServlet |
|
servlet-mapping\url-pattern |
/xhtml/trun/dashboard.xhtml |
Indicates the mapping url for tRun servlet |
|
servlet-mapping\url-pattern |
/xhtml/management/dashboard.xhtml |
Indicates the mapping url for Management servlet |
|
resource-ref\ res-ref-name |
jms/TAFJQueueConnectionFactory |
Configures the JMS Connection factory used by ExecuteServlet |
|
resource-ref\ res-ref-name |
jms/T24EXECQueue |
Configures the JMS EXEC Queue used by ExecuteServlet |
|
resource-ref\ res-ref-name |
jdbc/t24DataSource |
Configures the data source for monitoring purpose |
|
resource-ref\ res-ref-name |
jdbc/t24LockingDataSource |
Configures the Temenos Transact locking data source for monitoring purpose |
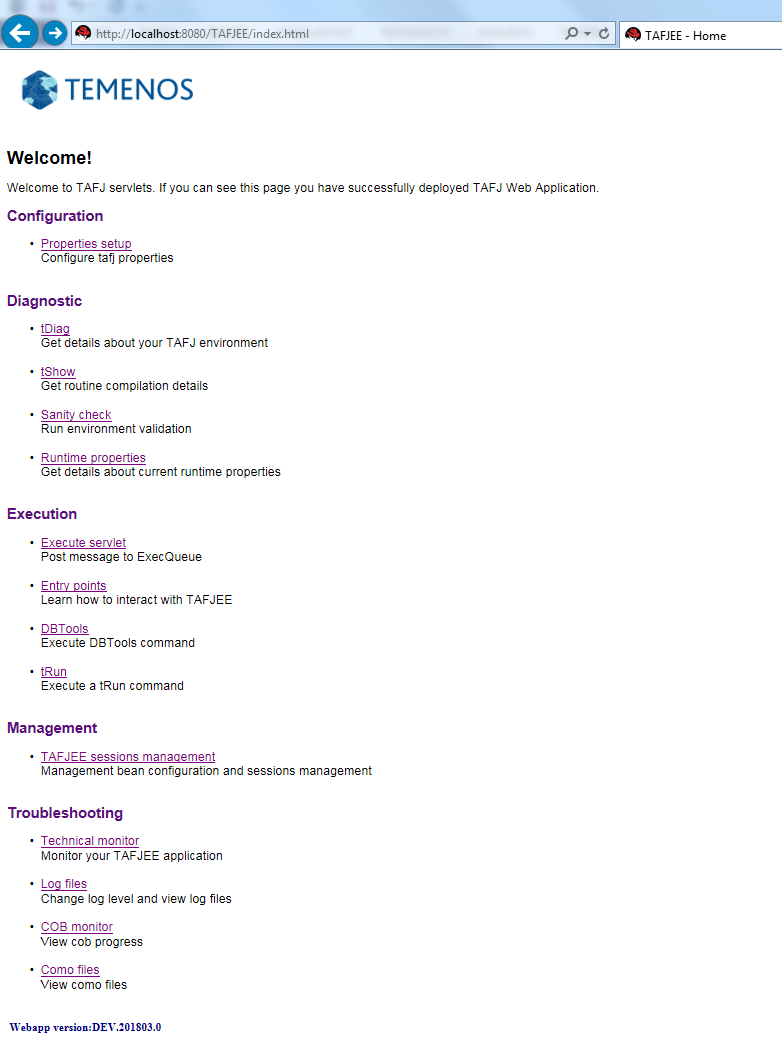
The functionalities of the various servlets are as follows:
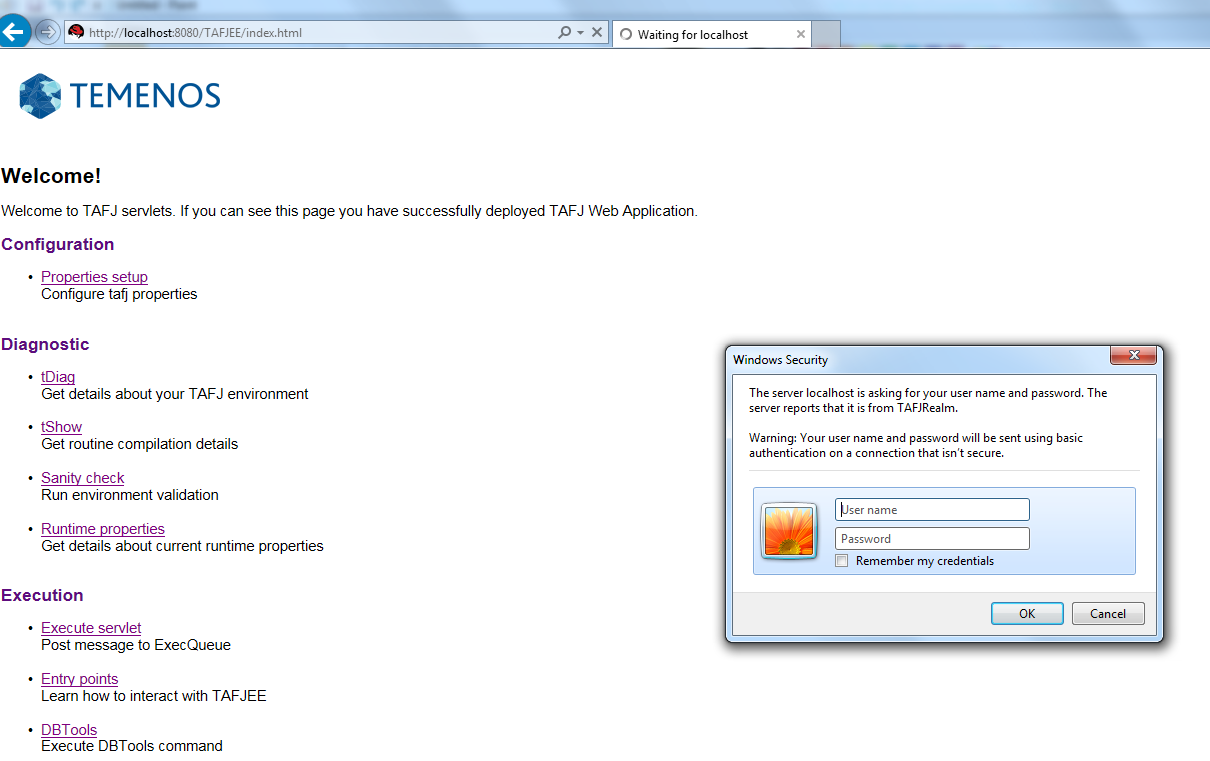
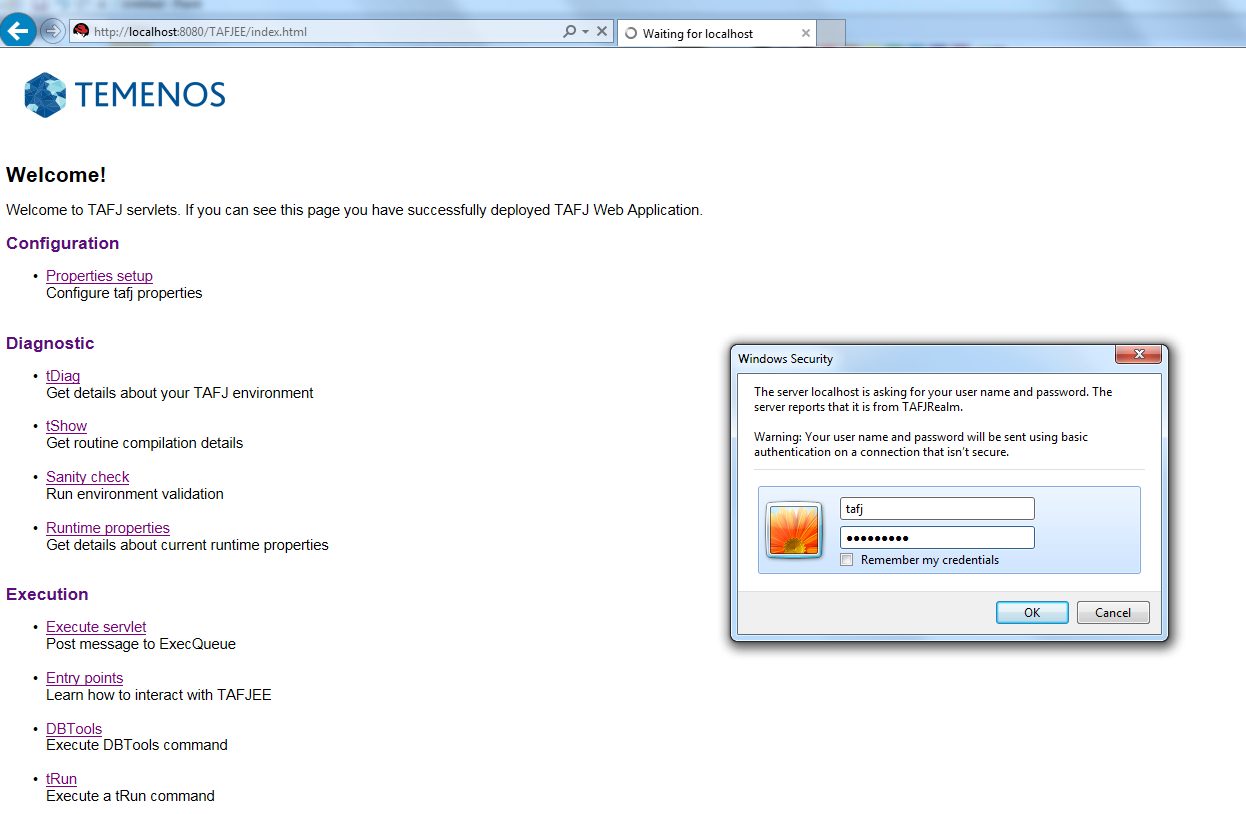
You can browse http://HOSTNAME:PORT/TAFJEE/ to verify if the installation is successful.
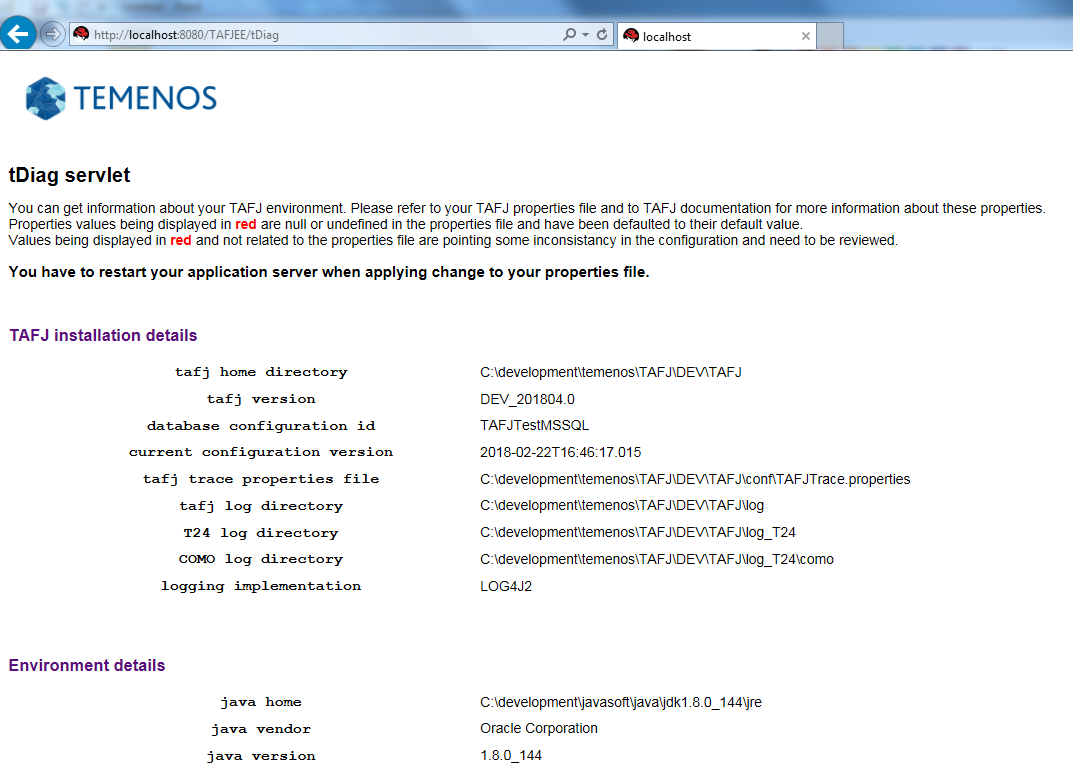
You can browse http://localhost:8080/TAFJEE/tDiag to get the TAFJ installation details.
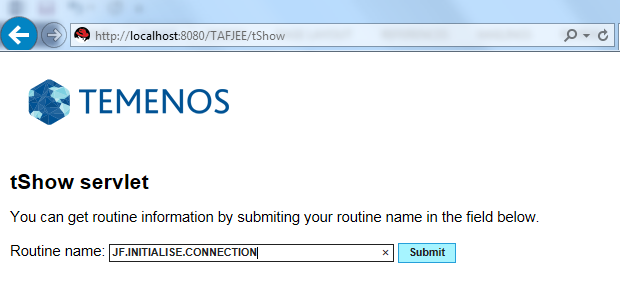
You can browse http://localhost:8080/TAFJEE/tShow to get details about the JF.INITIALISE.CONNECTION JBC routine.
You need to post a message to the T24.EXEC.QUEUE to start a program in background through the PhantomListener MDB. The program must be authorised and the only program authorised by default is START.TSM. To allow other programs to be executed, you need to set the temn.tafj.appserver.execute.servlet.allowed.commands tafj property as a coma separated list of authorised program names.
temn.tafj.appserver.execute.servlet.allowed.commands=START.TSM,TEST.BACKGROUND
You need to restart the application server to consider the property change.
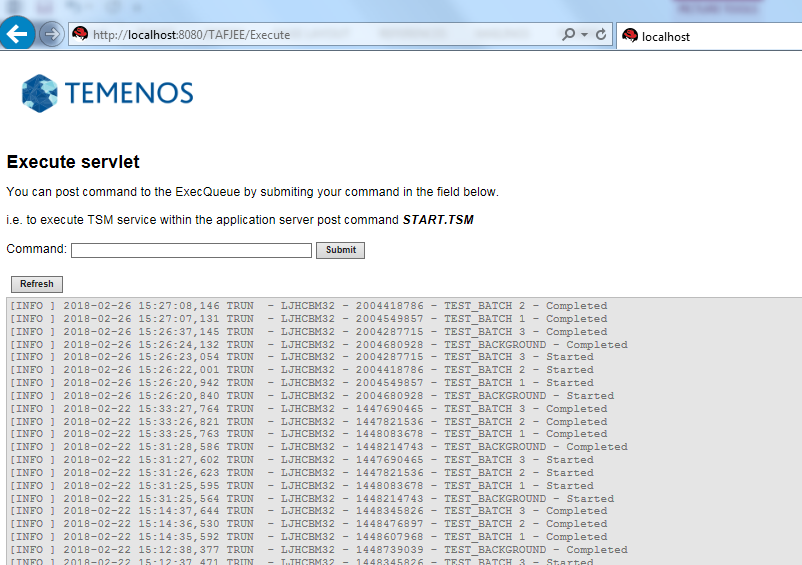
To start the COB, you need to post START.TSM in the form and check if the como folder is created and como files are generated.
You can browse http://localhost:8080/TAFJEE/logger to change log level and access log file content.
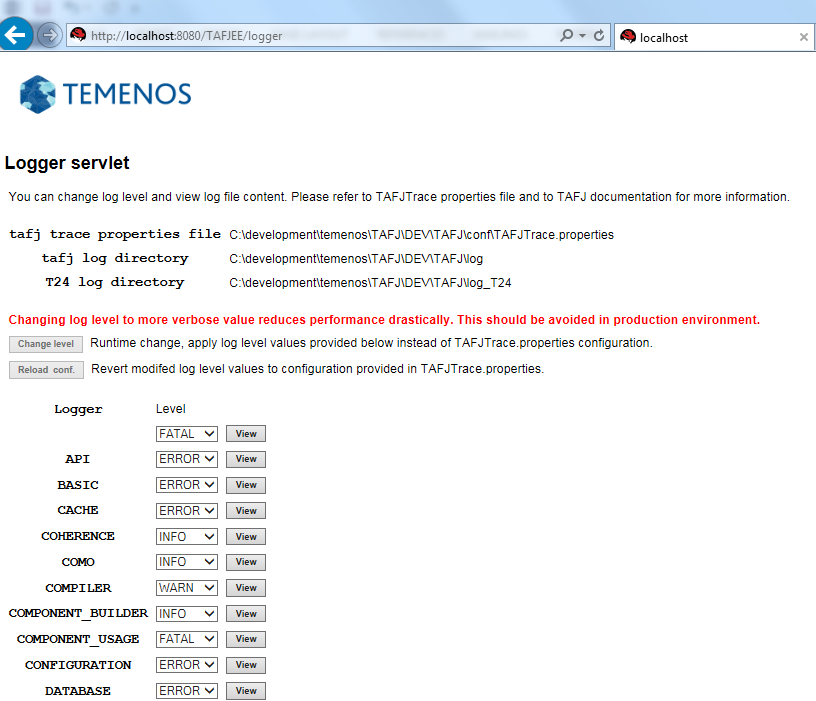
This servlet allows changing the log level of any TAFJ loggers dynamically without having to restart the application server. This is a runtime change which does not impact the TAFJTrace properties file, which is useful to temporarily change the log level to a verbose value to get more information in case of unexpected application behavior. However, you need to mindful usage of the same in production environment as large verbose logging configuration can impact the performance.
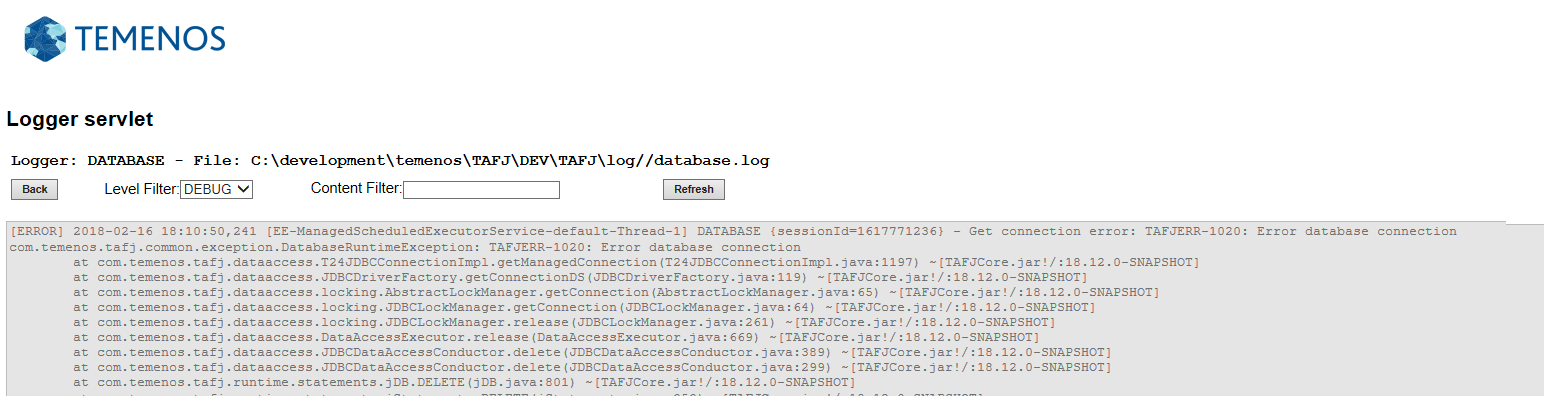
To change the log level for a specific logger, you can select the appropriate level from the combo box and apply the change by clicking the Change level button.After collecting sufficient details, you can revert the initial level by clicking Reload conf or changing the value from the combo box. You can also directly access the log file content from the servlet, by clicking the View button.
The current log file content will be displayed. If there is log file rotation (because of many information reported) you will have to access the physical log folder to collect the history.
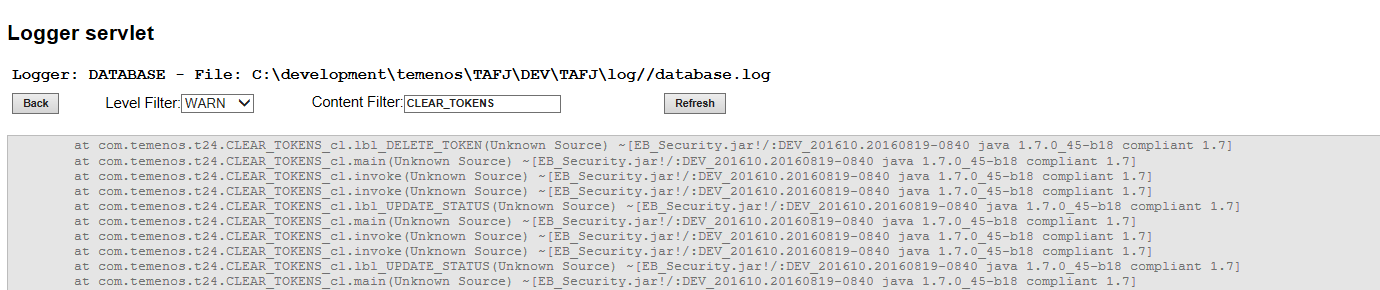
This log viewer also provides filtering functionalities if you are interested in a specific information or log level. You could narrow the log level with the combo box to keep only the logging information which is equal to or higher than the selected level. For example, if you select WARN, you will get WARNING and ERROR messages only.
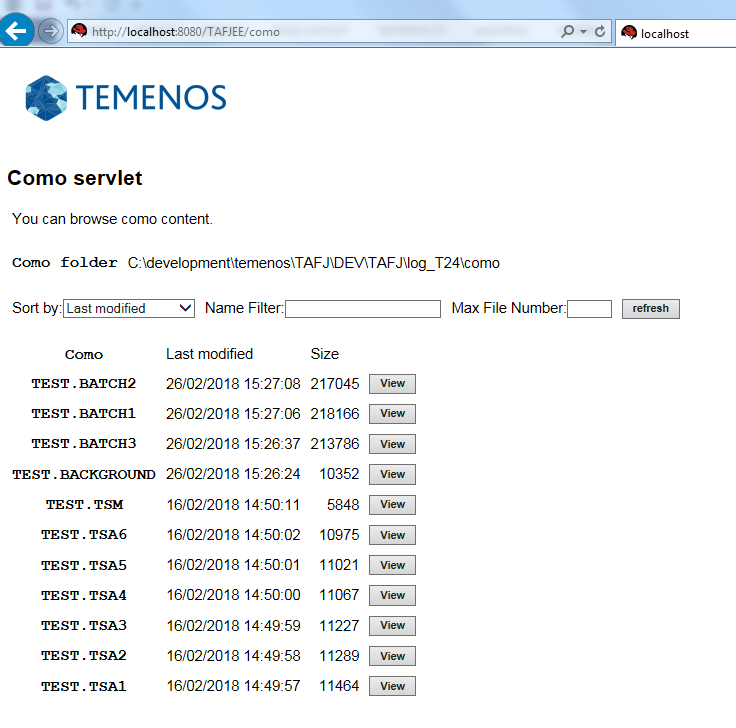
You can browse http://localhost:8080/TAFJEE/como to browse como file content from this servlet. This tool provides direct access to the como but is not a COB monitor. There is no automatic refresh functionality.
You can recall the servlet periodically to get an updated view.
You can sort comos by name and last modified date by changing the sort option value in the combo box. You can also raise view request for a specific file by providing its name or the last 10 files for example.
It has the similar browsing features as of logger servlet.
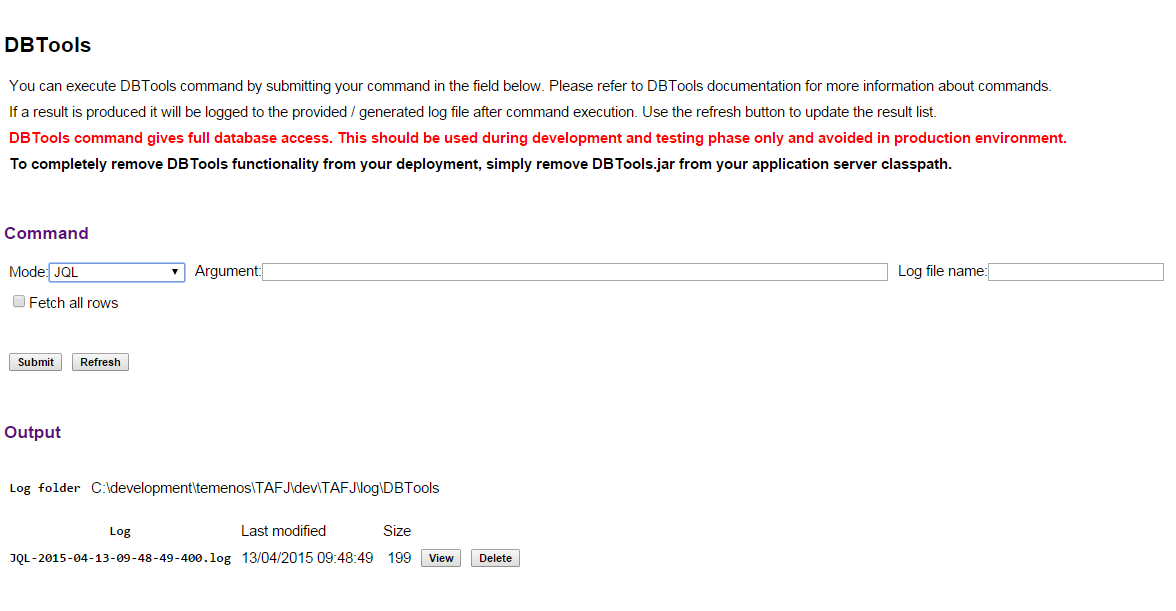
You can browse http://localhost:8080/TAFJEE/DBTools to execute DBTools command with TAFJJEE application.
The DBTools servlet is protected by the basic authentication mechanism. To create the user with required privileges, see the « basic authentication » section matching your application server provider.
You need to use the DBTools servlet along with DBTools.jar. If DBTools.jar is not a part of the application server classpath, the functionality will not be available.
The purpose of the tool is to provide access to DBTools commands through TAFJEE to database administrator during development or testing phases. When executing a DBTools command, a message is posted to the execute channel (Exec queue) to invoke DBTOOLS routine deployed within DBTools.jar. This is an asynchronous invocation as it could be a long running job.
For familiar DBTools users, the command is executed in script mode with a log file as result renderer.
tRun DBTOOLS -s -log aLogFileName SQL SELECT \\* FROM FBNK_CURRENCY
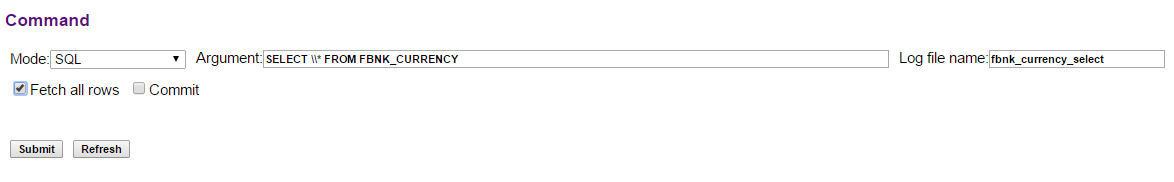
The command is executed in the background mode and output is sent to a default generated log file (command type - timestamp) or user specified log file name. To execute a command, select the command type from the combo box, enter the command argument(s) in the argument field and optionally a log file name.
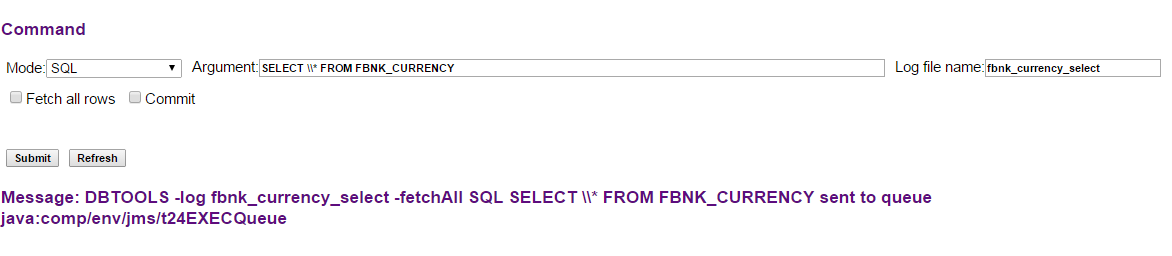
If you click the Submit button, the JMS message corresponding to the command is posted to ExecQueue for processing and displayed. Depending on the command type an output is generated and if you click the Submit button, you can view the output list.
When executing SQL command, you need to use the Commit check box for commands updating data.
For example, if you enter a SQL command and click Submit, you can see the fbnk_currency_select.log file in the output list on clicking Refresh.
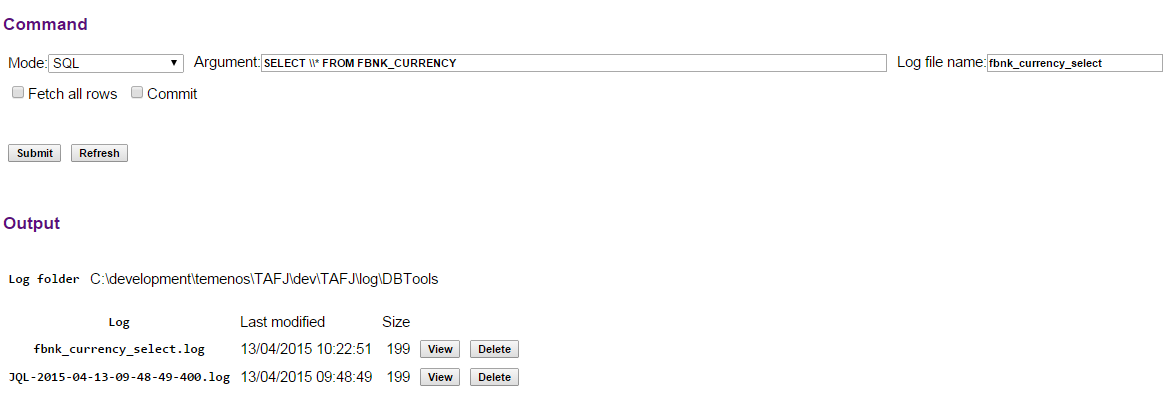
You can delete the log file if it is obsolete and no longer in use.
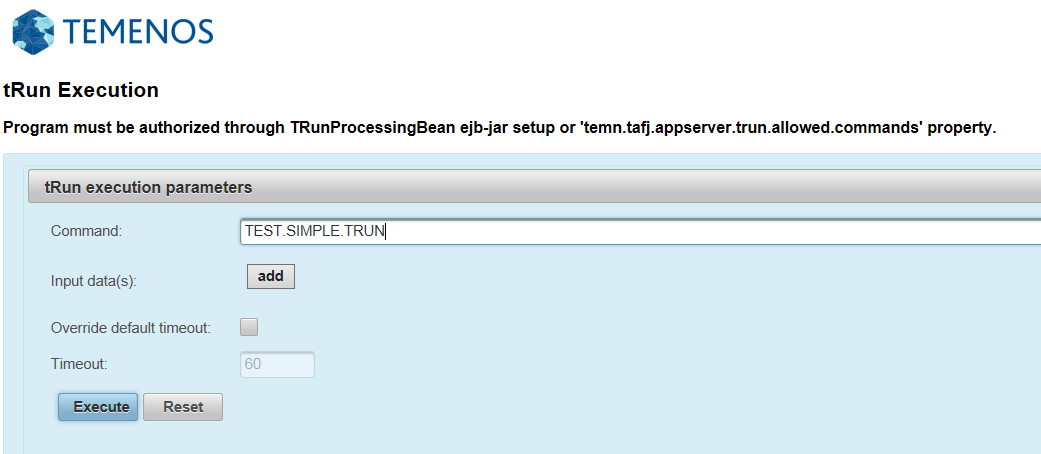
You can browse http://localhost:8080/TAFJEE/xhtml/trun/dashboard.xhtml to execute a program in the background with TAFJJEE tRun application.
The tRun servlet is protected by the basic authentication mechanism. To create the user with required privileges, see the « basic authentication » section matching your application server provider.
The tRun processing is handled by the TRunProcessingBean ejb deployed within TAFJEE_EJB.jar.
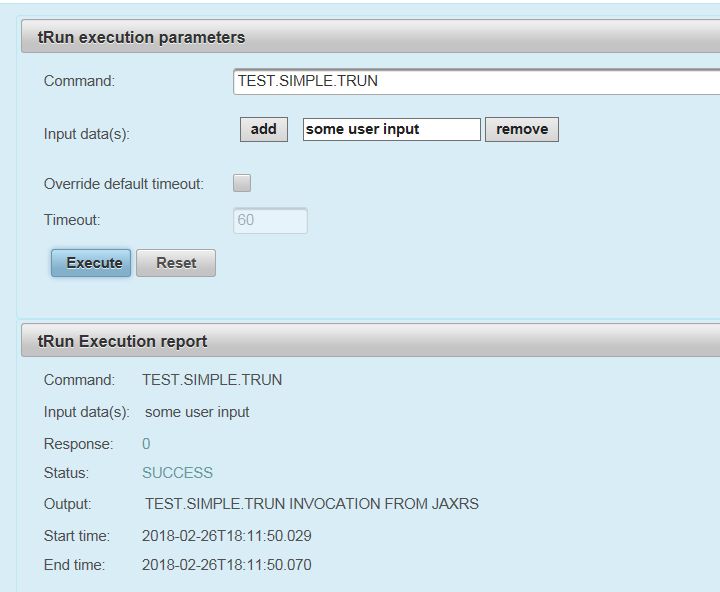
As the program is authorised, you can enter the command arguments and click Execute to trigger it through the tRun Execution interface.
An execution report is generated following an asynchronous invocation, since the execution is terminated and result is available.
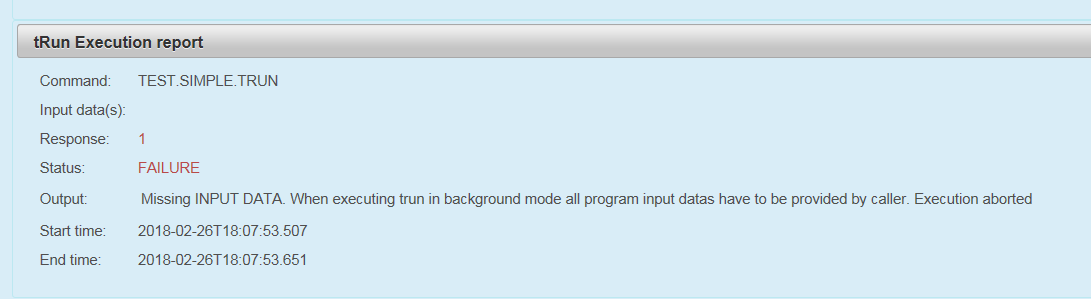
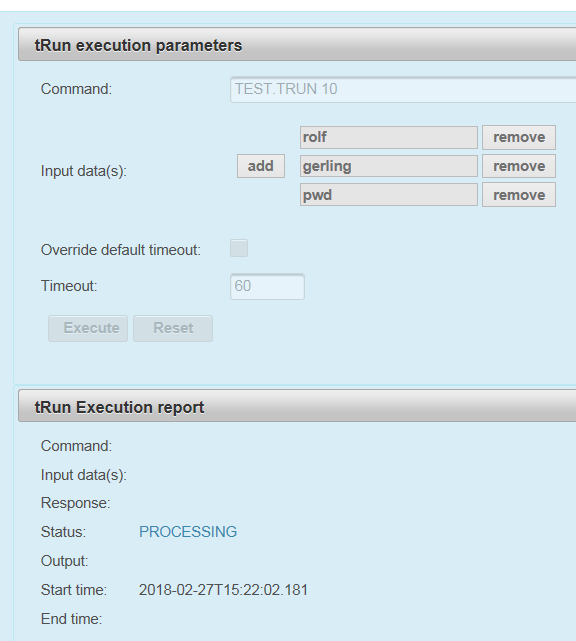
In the above example, a program requires some user input data (INPUT JBC statement). Since those details are missing, the program execution is aborted. You can add input data as many as required using the add option in Input data(s) and the Execute button triggers the program execution.
For long running programs, the status PROCESSING is displayed and the result is displayed once available. You cannot execute another program with the same session simultaneously.
The status and results of execution are:
|
Status |
Program Response |
Comments |
|---|---|---|
|
Success |
0 |
Result is highlighted in green in the execution report panel |
|
Failure |
1 |
Logs are checked to understand if the issue is not related to missing input data |
You need to use the Reset button to clear the execution report and execution parameters.
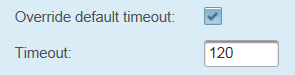
In case of a long running job, the default tRun timeout defined at EJB level (ejb-jar.xml) may be short and you need to override to avoid a session expiration before execution completion. You can enable the Override default timeout: checkbox and set the appropriate value in Timeout: before triggering the program execution.
In this topic