Representing Inflow with Grafana
This section details about the Temn monitoring tool Grafana, a graphical representation which helps in tracing and vizualizing the event for the data inflow.
Grafana provides
- The graphic representation which helps in understanding the data flow.
- The utility for monitoring the success and failure event in both staging and processed event in a specific time range.
- The analytic utility like 'Sum', 'Avg', 'Throughput per sec', 'Avg over the time' and so on.
To configure the Grafana dashboard,
- Login to Grafana using the URL http://localhost:3000/login. {admin/admin}
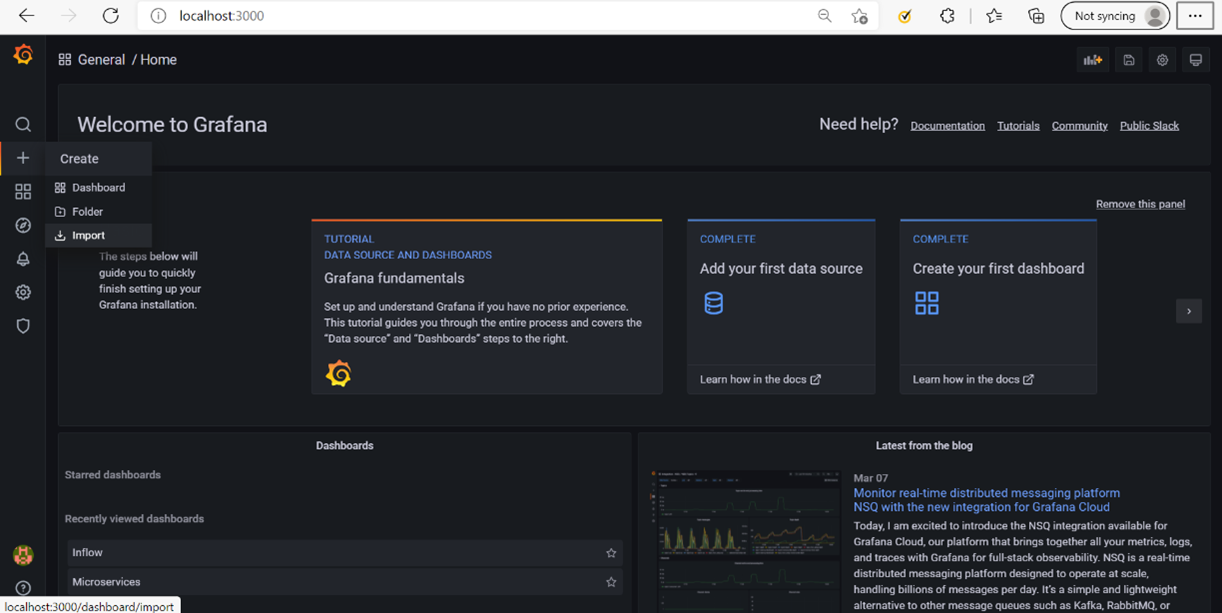
- Navigate the + button and choose the import option
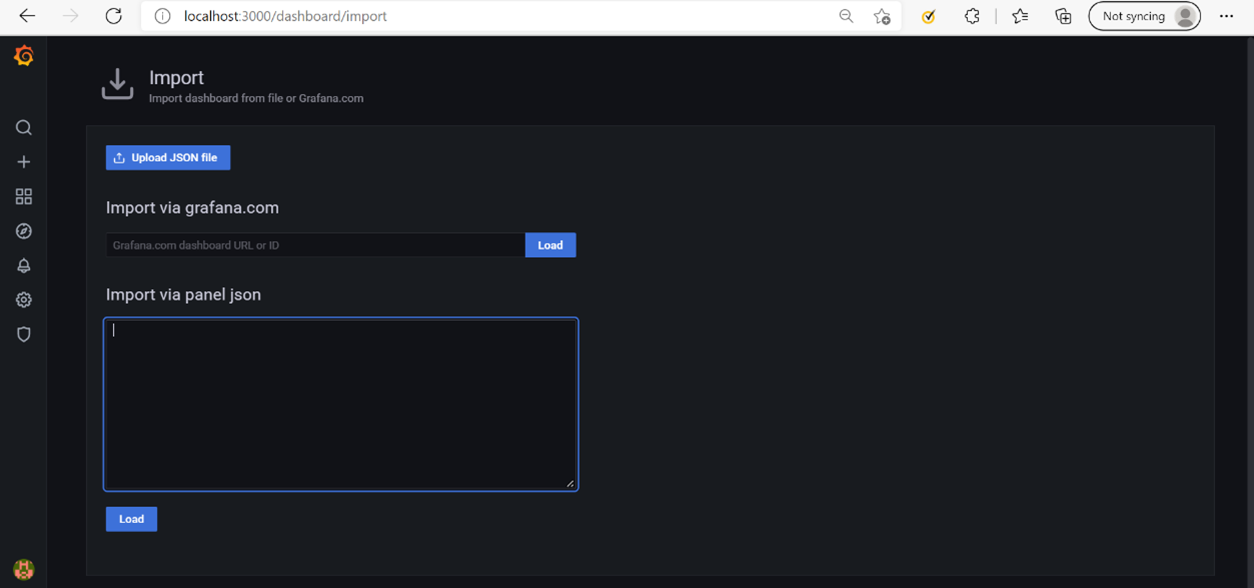
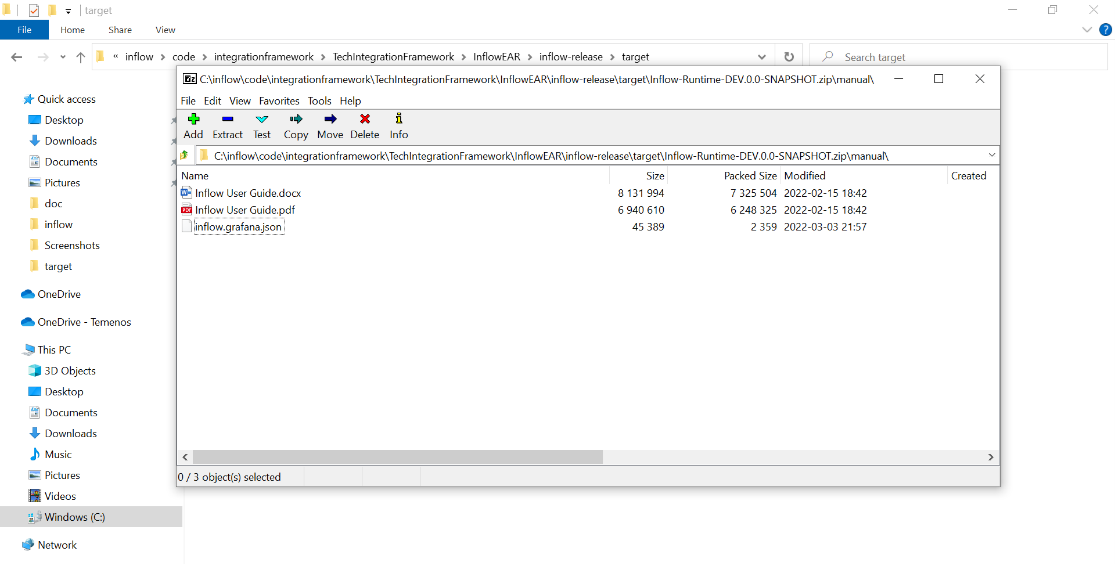
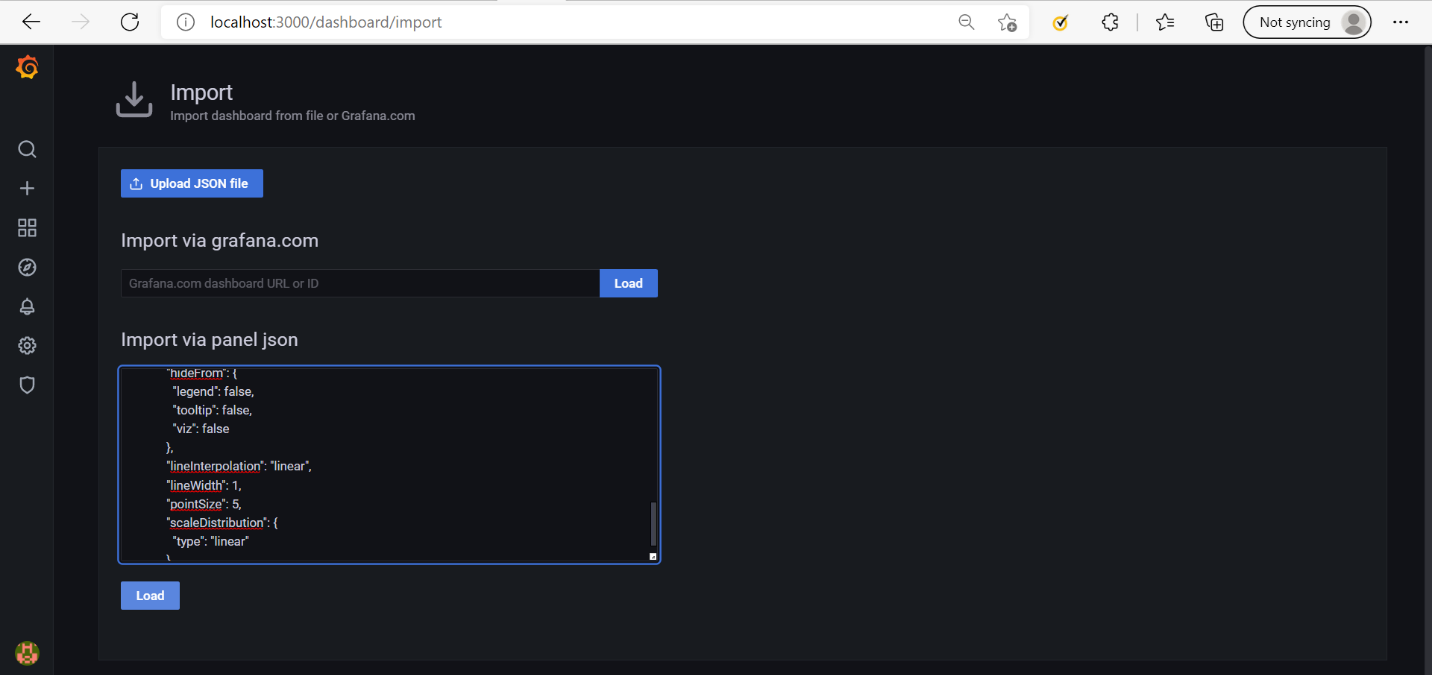
- Copy inflow.grafana.json script and paste into the import via panel json textbox and click Load button.
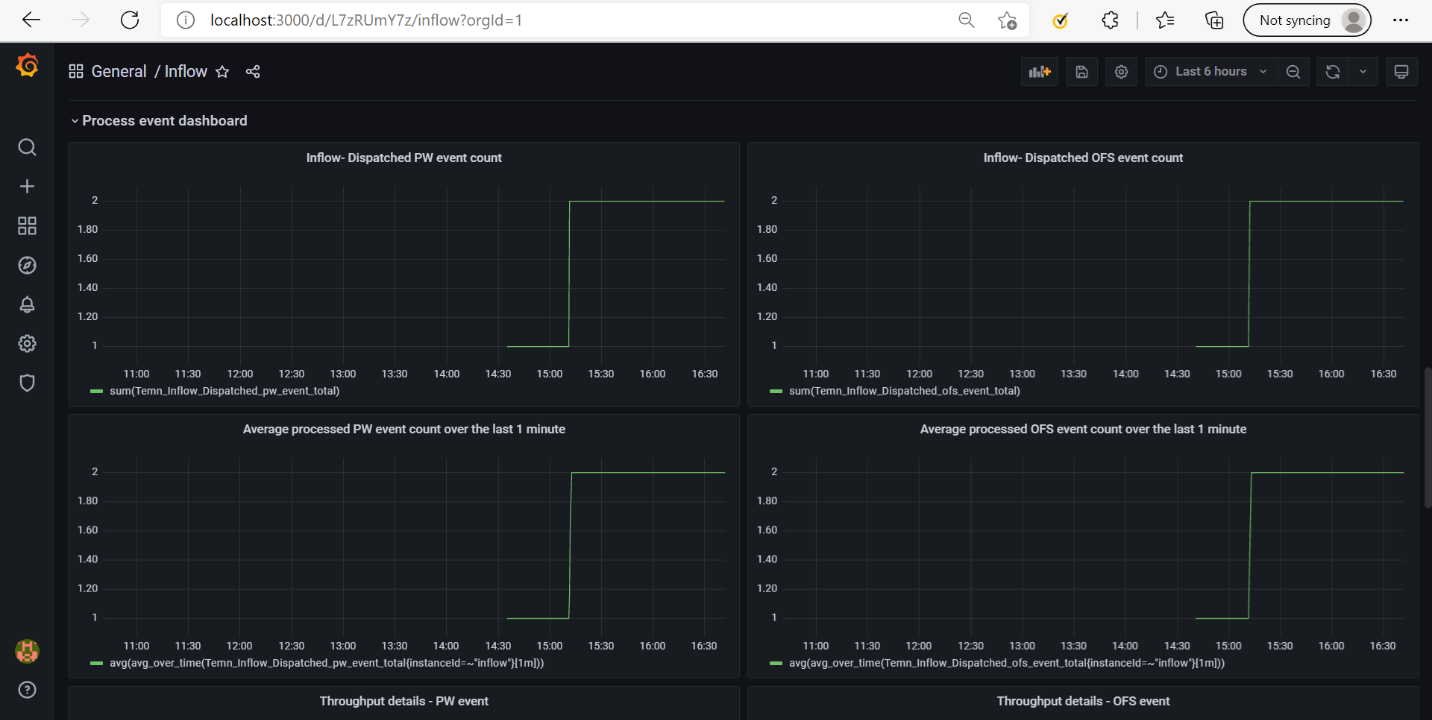
- Now Grafana visualization uploaded with the given event as shown in the screenshot below.
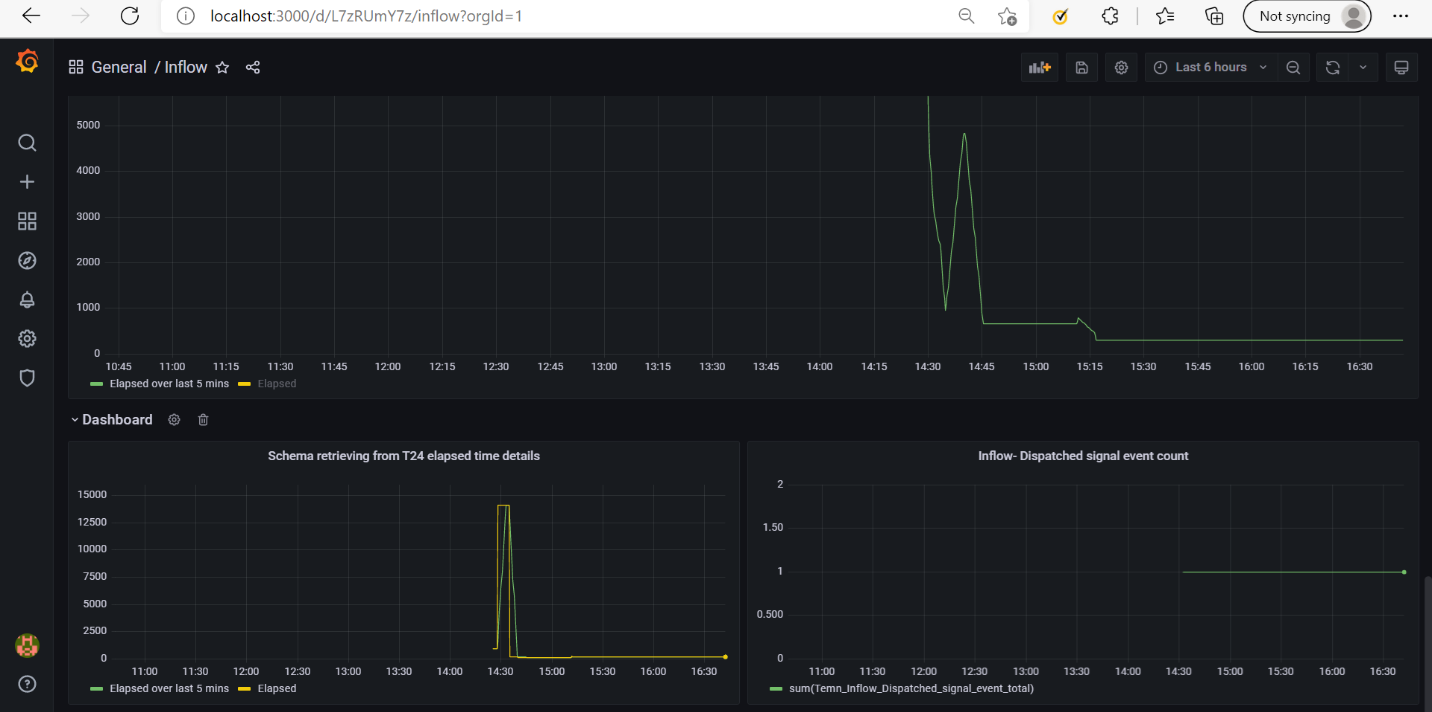
Grafana Dashboard
This section details the different Grafana Dashboards.
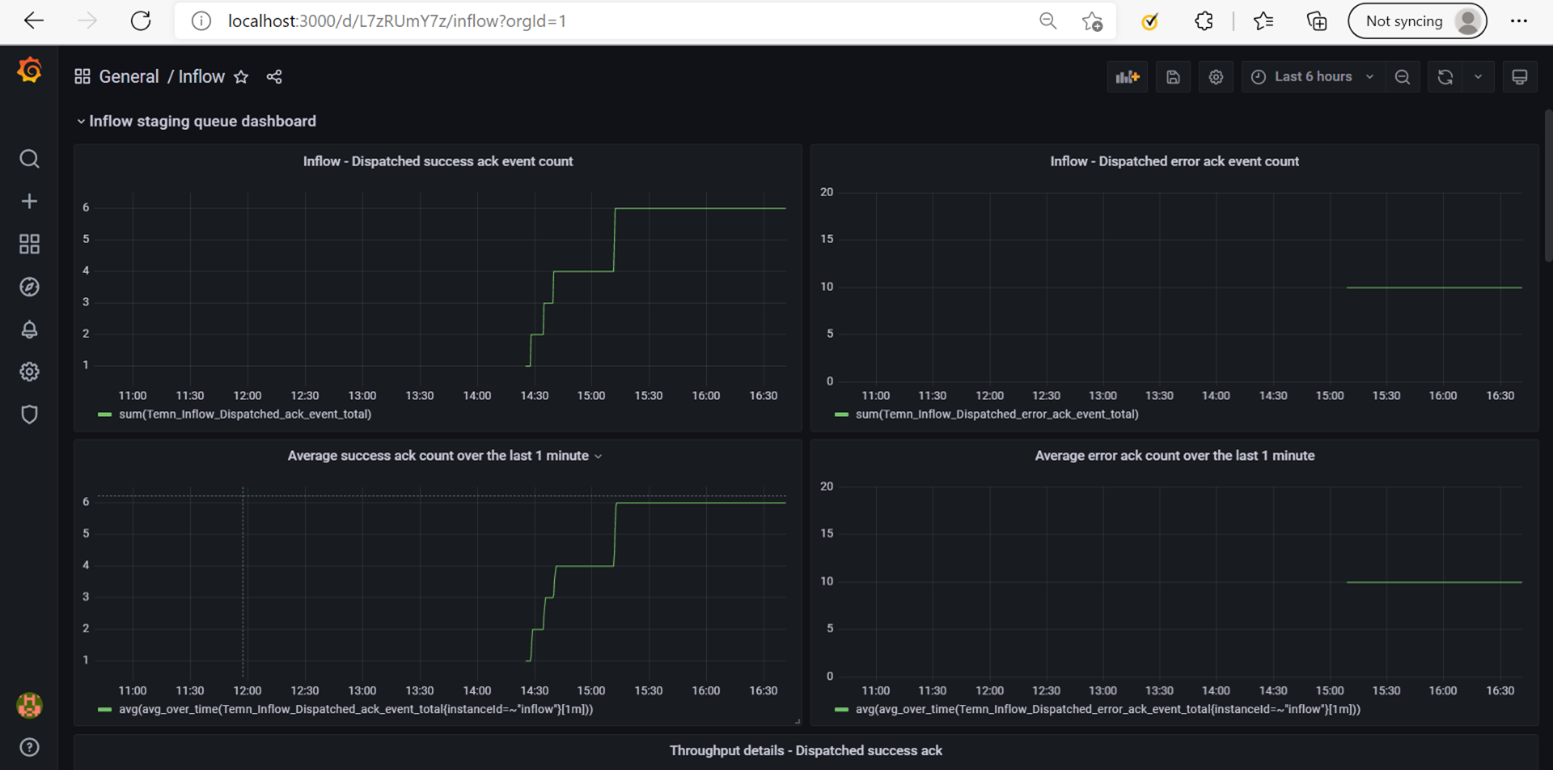
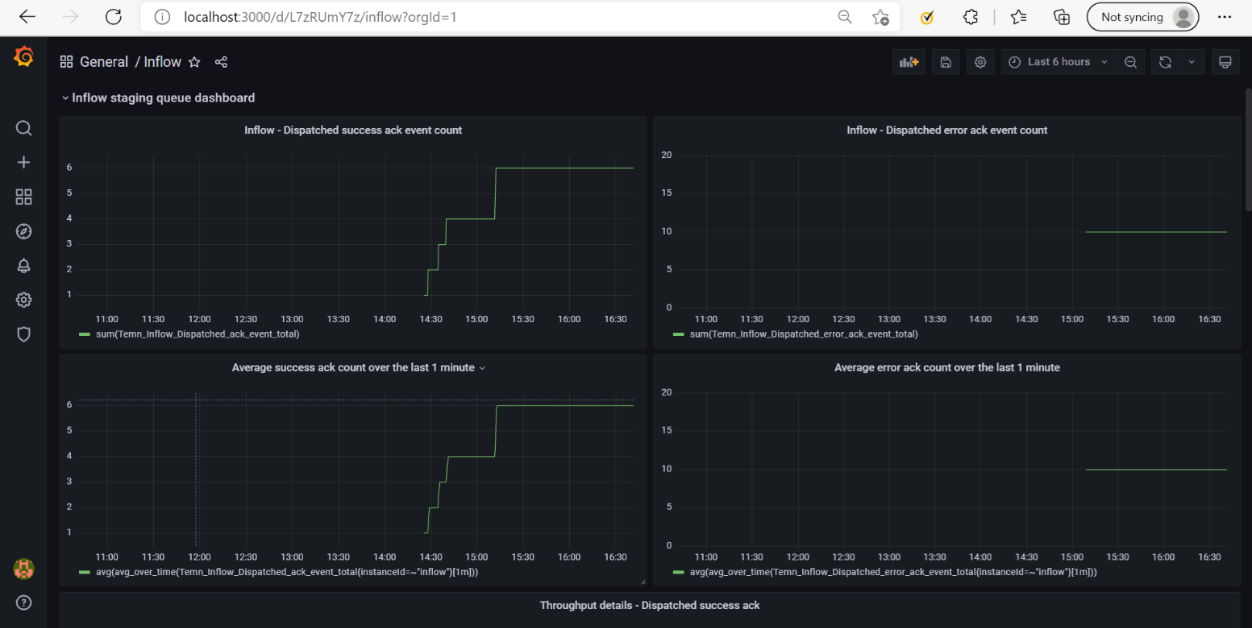
Staging Module Dashboard
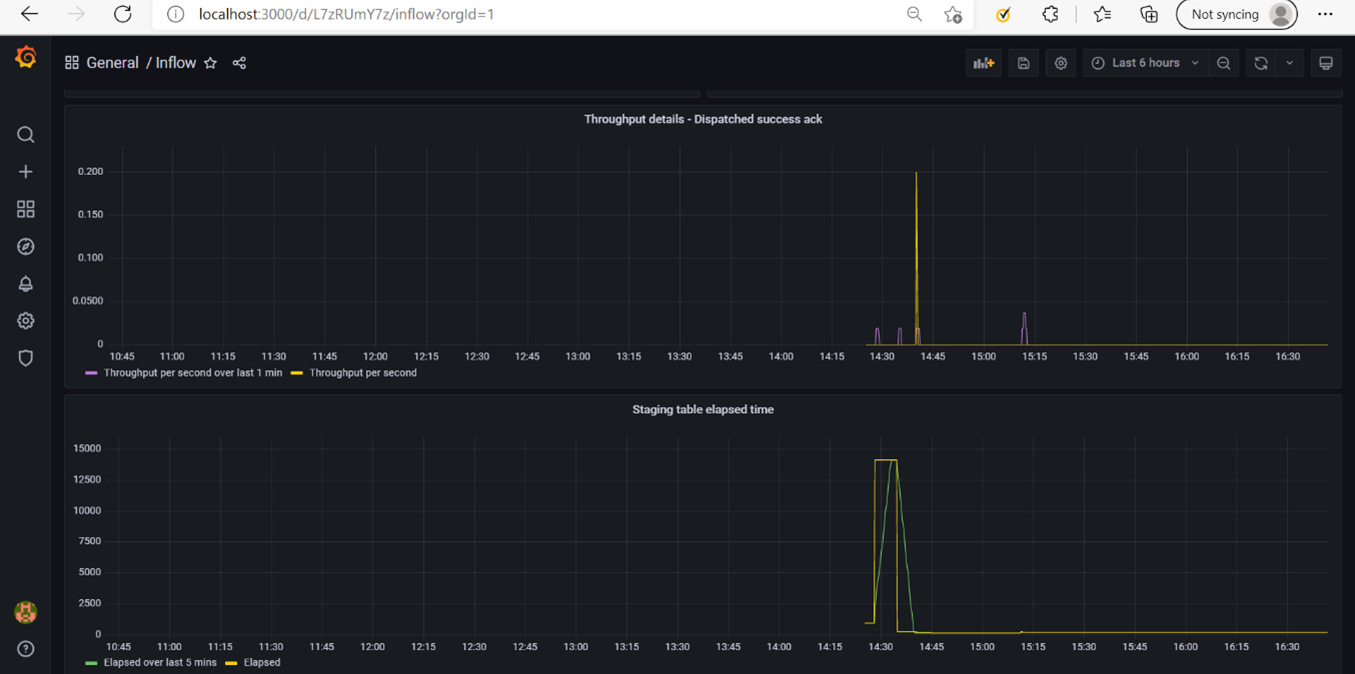
Inflow request that needs to be processed are saved to the table(IF_INFLOW_MESSAGE). This module exposes the total count, average and throughput of successfully stage and failed event as a grafana dashboard.
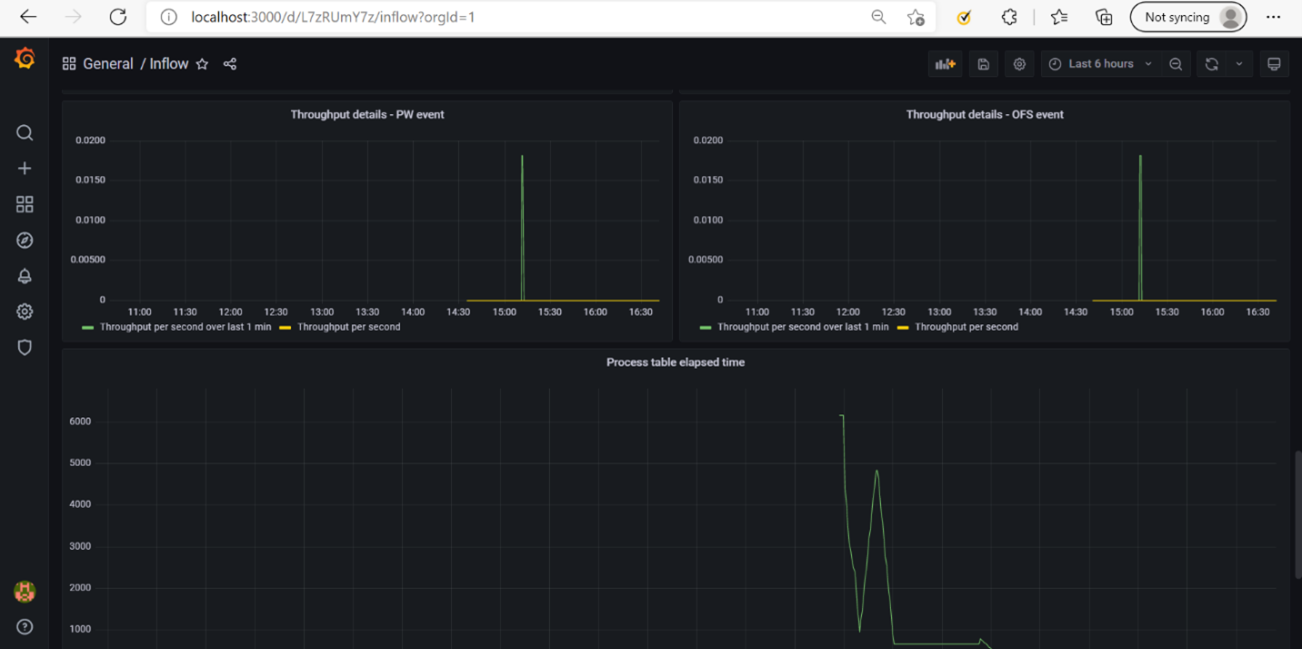
Processed Module Dashboard
Processed messages are saved into the table(IF_INFLOW_MESSAGE_PROCESSED). This module exposes the total number of the processed message count, average and throughput.
Signal event Processed table Grafana dashboard exposes the total number of single events received from Transact.
In this topic