Spend Analysis
Use the feature to view the trend of your expenses for current and previous months. There are two sections where you can view these information.
- Overall Spending (Yearly)
- My Spending (Monthly)
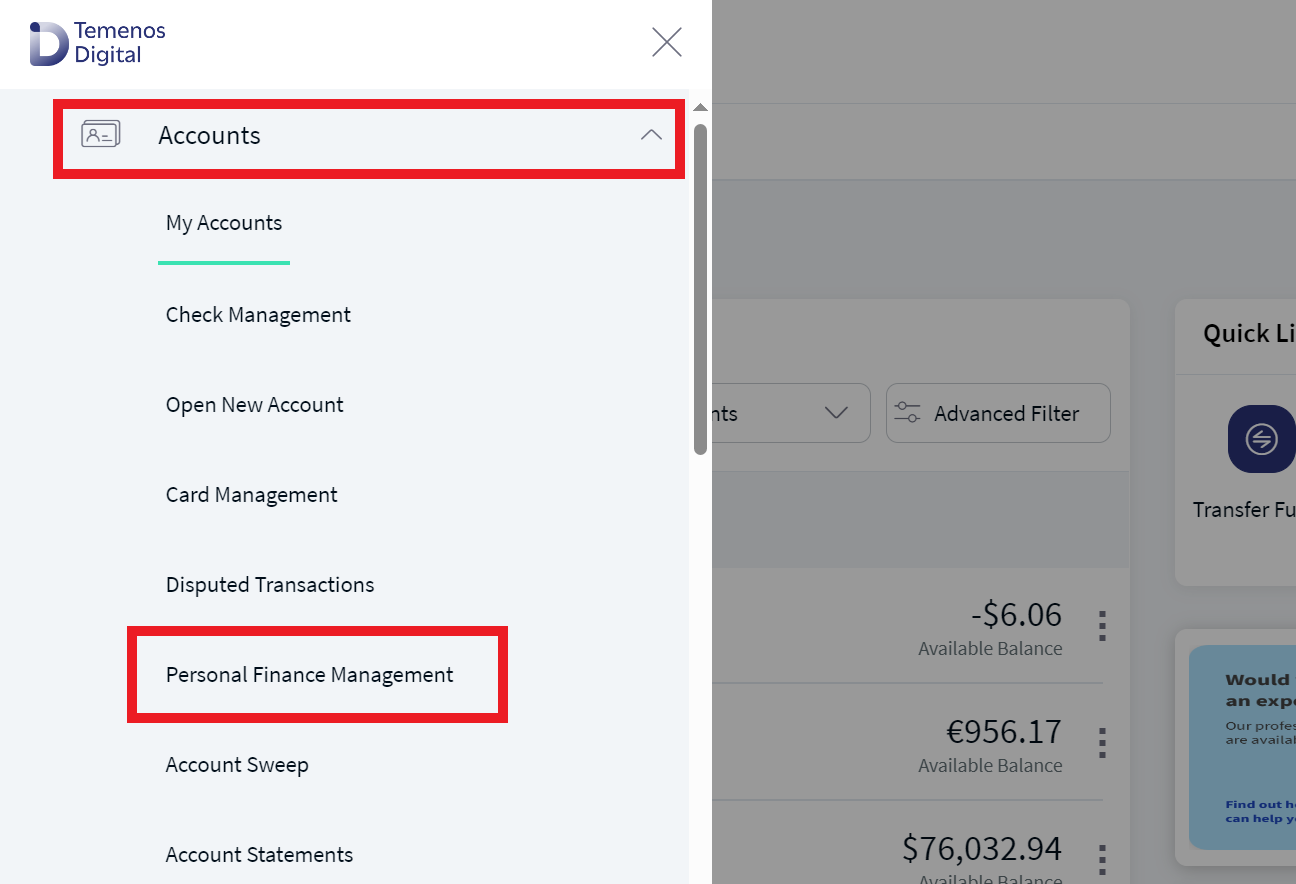
Menu path: Web Channel > Side Menu > Accounts > Personal Finance Management
Alternatively, you can click My Spending widget on the dashboard.
Menu path: Mobile Native
From the bottom menu, tap Menu > select My Money.
Web Channel
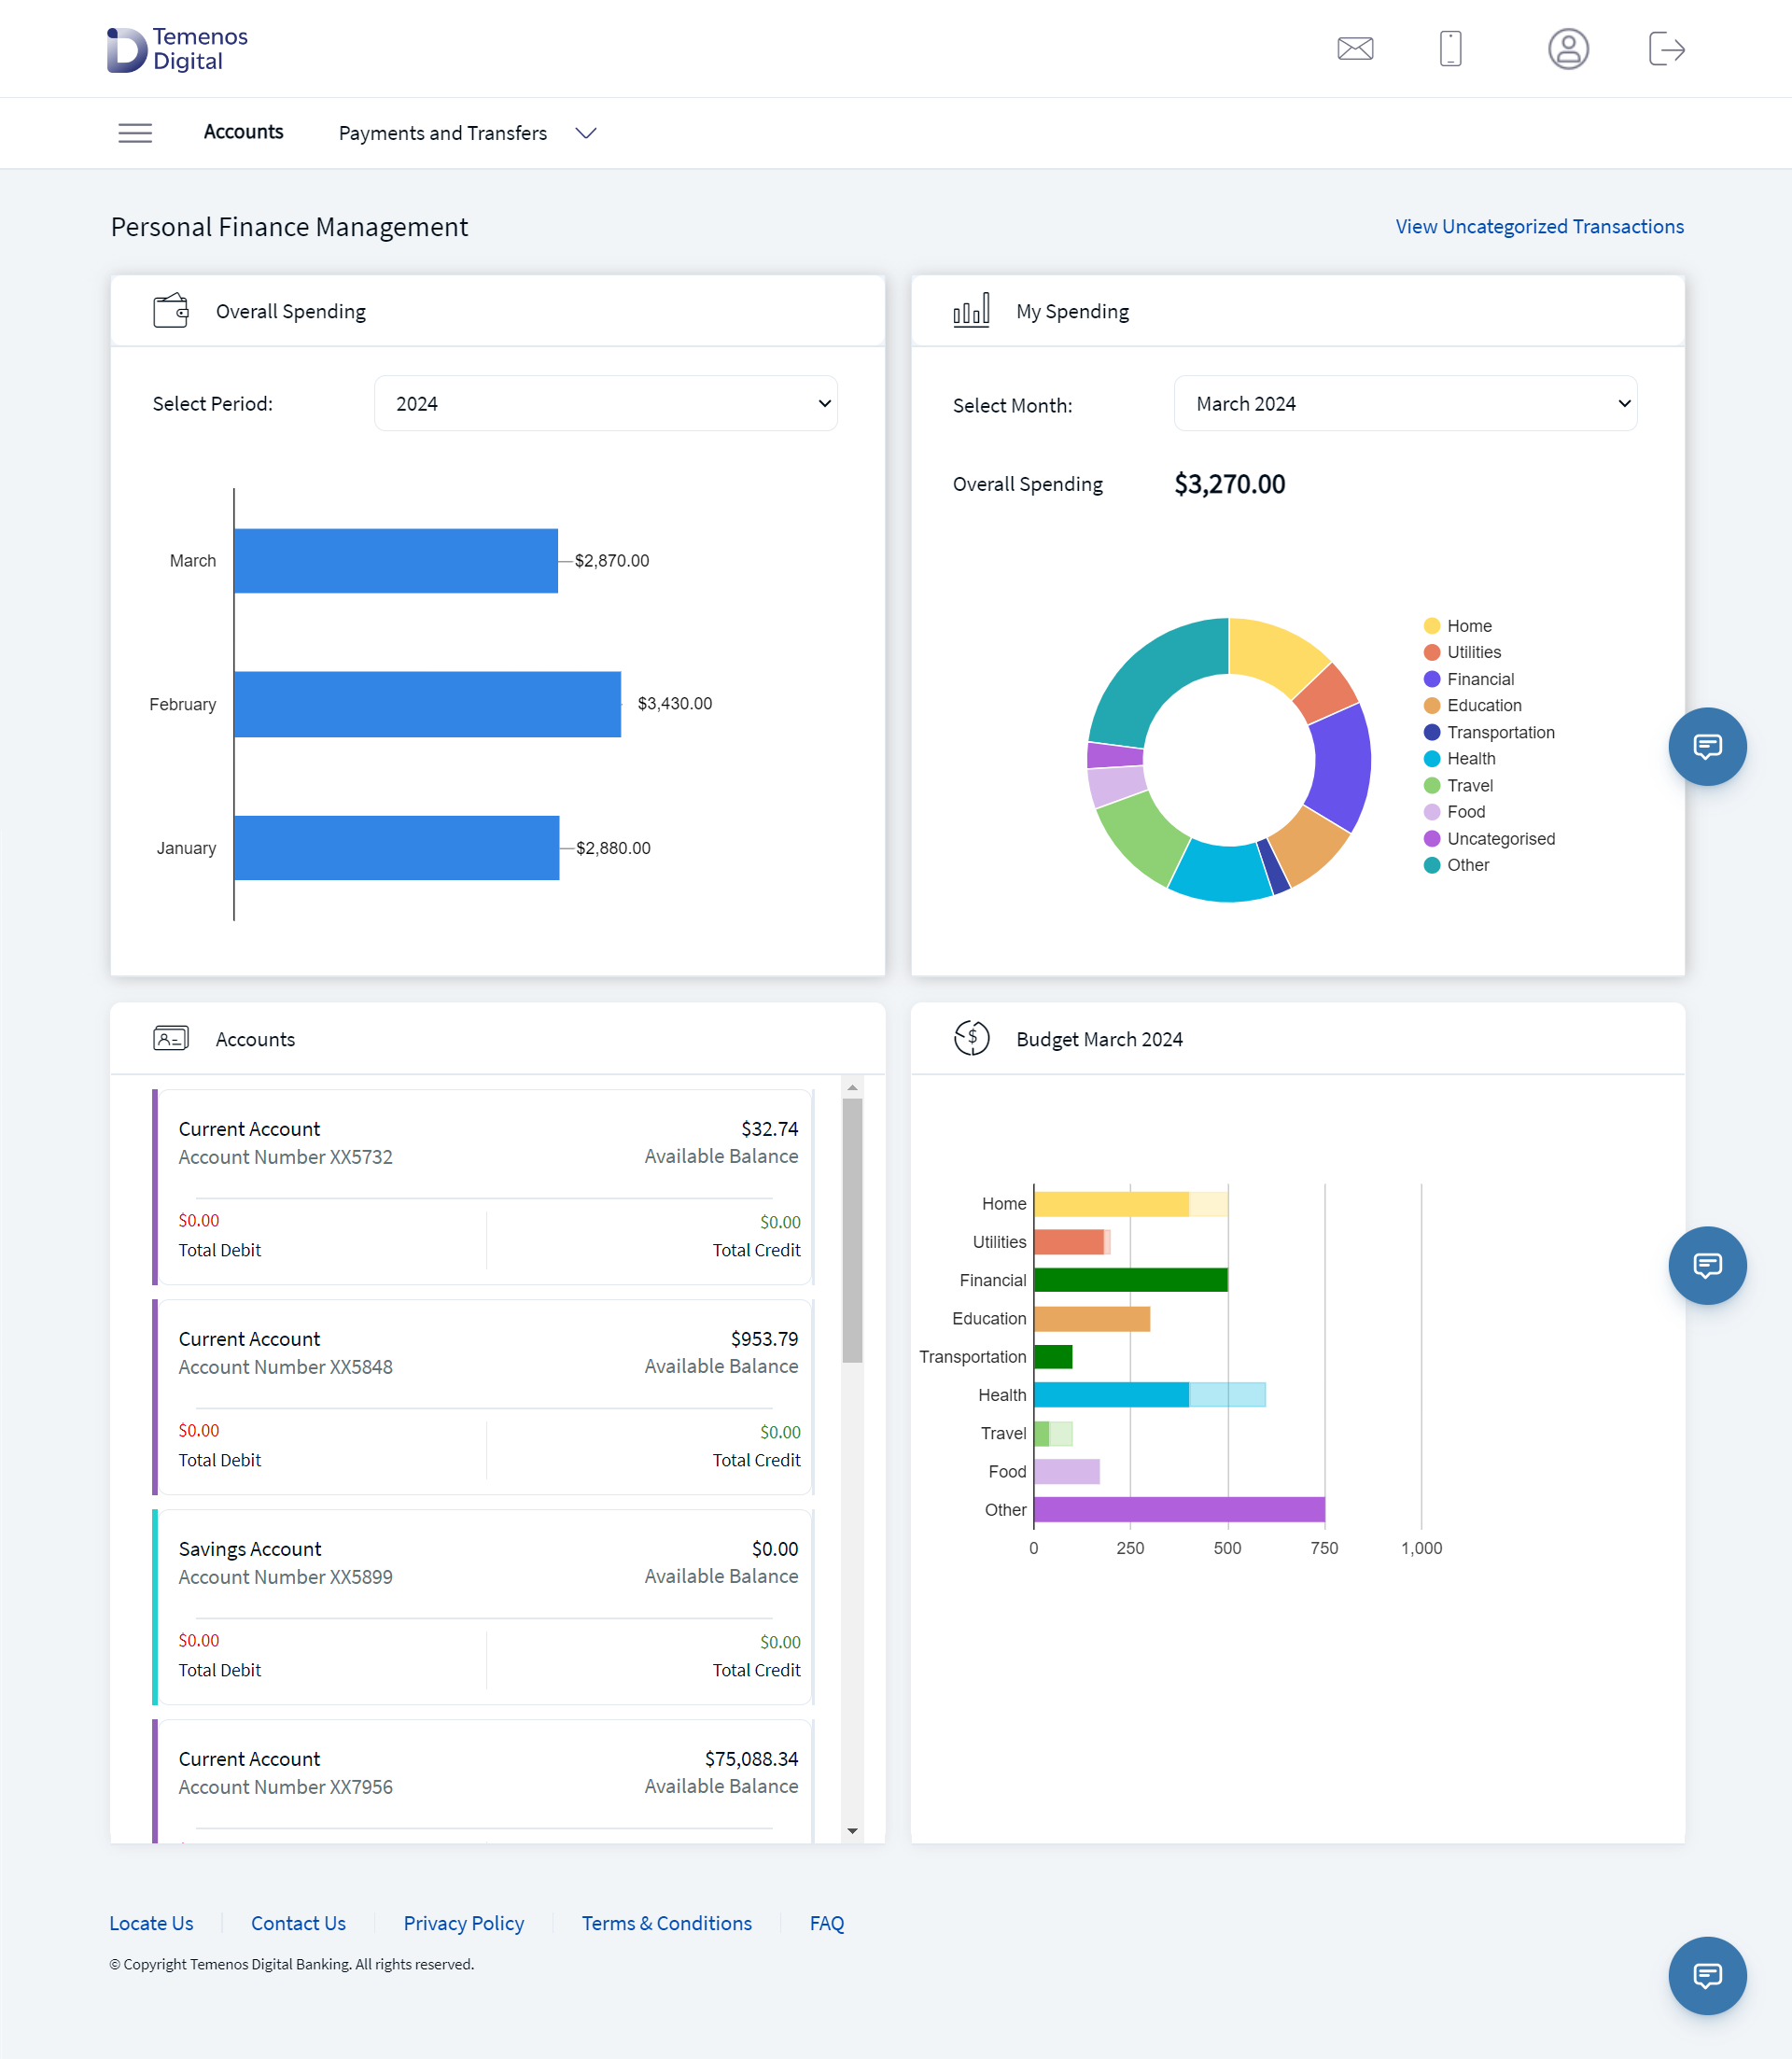
The app displays the PFM screen with yearly and monthly spends in the Overall Spending and My Spending widgets respectively. The Overall Spending widget displays the spends across all the previous months of the selected calendar year from the Select Period list. The list contains all the calendar years since you opened the account, and by default, the current calendar year is selected. The total spending of each month is displayed in the form of a bar with the name of the corresponding month.
The My Spending widget displays the monthly spending made from all the accounts across all the categories in the form a pie chart. By default, the current calendar month is selected.
To view the spend analysis of the specific month, select the required month from the Select Month list and the app displays the category wise expense pie chart for the selected month. Click on the required category to view the detailed list of spending in that category. You can also select the required months bar graph in Overall Spending widget to view the detailed list of spending made in each category for the selected month.
The app displays the list of expenses made with their respective categories. The list is shown in the form of a table with the rows having the following details - Date, Description, Category, and Amount.
Click the down arrow to view the details of the required spending. The details shown are - From, To, and Notes.
Mobile Banking
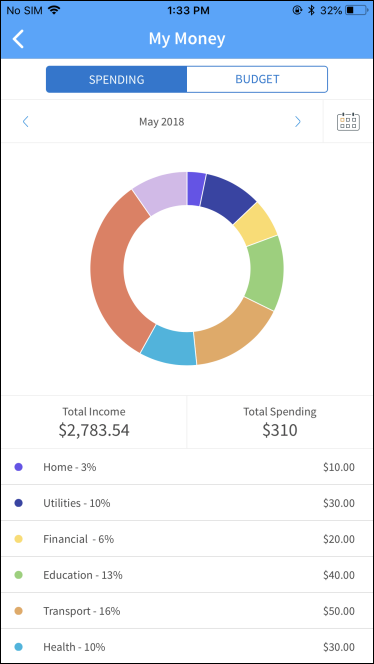
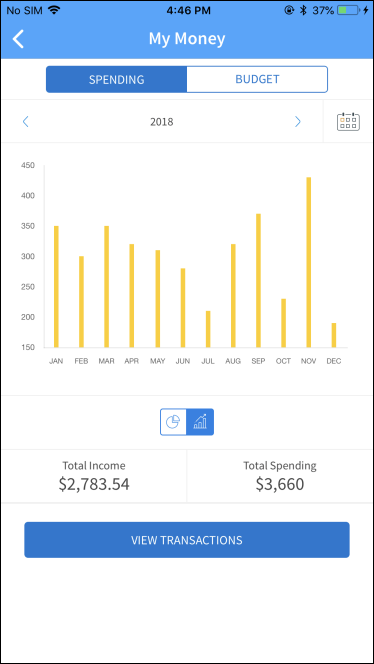
The app displays the My Money screen with Spending tab selected by default. Select budget tab if you want to view the estimated budgets and spending made in accordance with the budget.
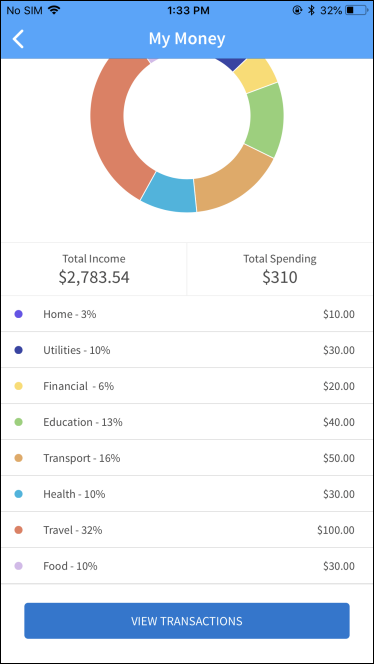
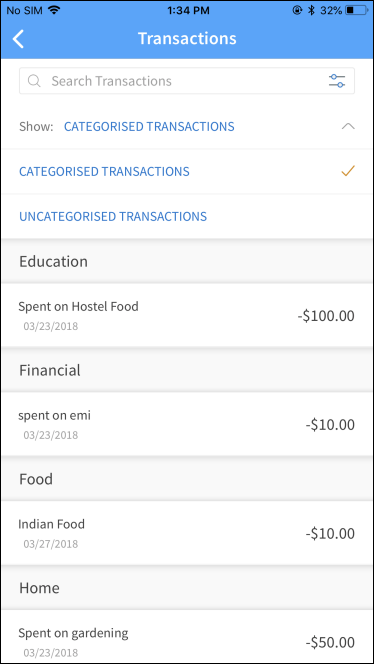
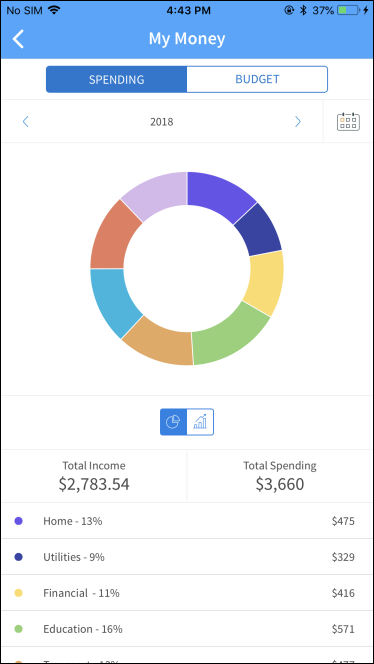
The spending tab displays the current month spending made from all the accounts across all the categories in the form of a pie chart. The other information showed here are Total Income, Total Spending, and list of spends in each category. Tap the < or > arrows to change the selected month or year. Tap View Transactions to view the complete list. Provision to view the categorized and uncategorized transactions is available.
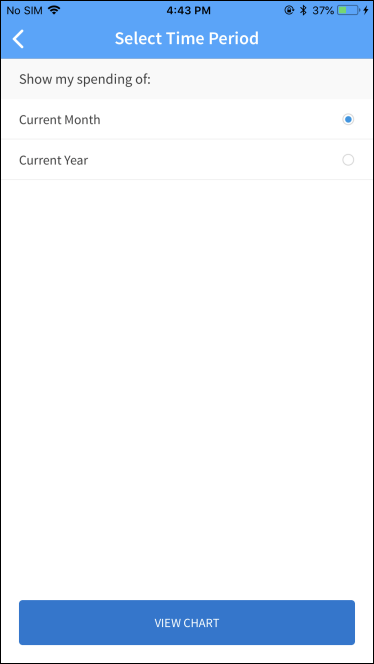
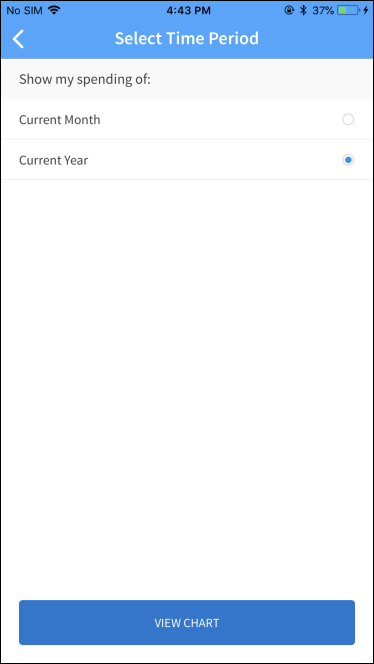
Tap the calendar icon to change the monthly pie chart view to yearly pie chart view. Select the required view mode (current month or current year) and tap View Chart. The spending chart changes accordingly. In the year view, you can also view the spending in graph view when you tap the graph icon (year mode).
Spend Analysis for an year
Graph View
In this topic