Dashboard View
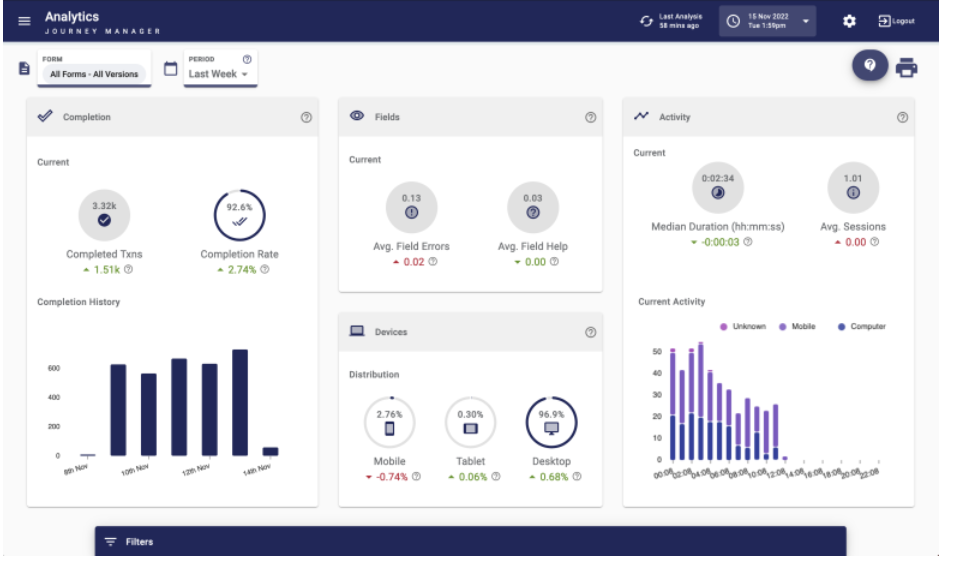
Dashboard view provides a high-level overview of the transactions specific to an application for a specific time period. It provides analysis of the key metrics such as completion statistics, field level statistics, device distribution statistics, user activity statistics and recent completion history.
To display the Dashboard view for a specific journey, do the following:
- Select the Dashboard from the Navigation panel.
- Select the Application from the Form tab and click OK. Select the time period from the drop-down.
- The dashboard view displays based on the user's selection.

- The user can select multiple journeys in the Form selection card or click Select All button to select all the journeys.
- Click Clear button to clear the selection.
- Click Cancel button to cancel the selection.
The dashboard view displays the statistics having the following tiles:
- Completion Rate Statistics
- Field Statistics
- Device Distribution Statistics
- Activity Statistics
- Today's Active Sessions
- Application History Statistics
Current Activity
When the customer initiates the application, the bank user can analyze the activity of a journey. The bank user can track the Median Time (Median time taken for user journey wise).
The bank user can track the Average session, which is the average time taken for each journey (including save and resume) for each specific journey.
The bank user can track the Current activity of the data that is sent from the Temenos Digital Application on what is the current activity (the number of user journey’s initiated).
If there is no activity in Temenos Digitalapplication for the past 24 hours, then current activity displays No Transaction happened in past 24 hours.
To know more about the Dashboard View, click here.
In this topic